ABSTRACT
Background: Public health clinic pharmacies in Malaysia face severe operational strain, highlighted by a 19.9% surge in outpatient prescriptions from 2023 to 2024. This increase strains human resource management and poses a risk to service quality. Estimating patient arrivals may help anticipate the total workload for the day. Despite the widespread use of machine learning, Malaysian pharmacies underutilize it due to infrastructure and digital barriers. This study addresses this gap by analysing patient arrival data in a pharmacy setting and developing predictive models using machine learning. Objective: This study aimed to explore ARIMA/SARIMA and Random Forest (RF) regressors in building predictive models for patient arrivals at the Lukut health clinic pharmacy. Additionally, it seeks to characterize patient arrival data. Method: This retrospective observational modelling study collected a total of 1034 data points from the Lukut Health Clinic Pharmacy unit. Feature Engineering (FE) was used to create and modified features. One-Hot Encoding (OHE) was utilized to prevent ordinal assumptions. Result: The Pyramid ARIMA (pmdarima) identified the optimal ARIMA order as (1,0,2) (0,0,0,12), while GridSearchCV optimized the RF hyperparameters. Accuracy metrics, including Mean Absolute Error (MAE), Mean Absolute Percentage Error (MAPE), and Root Mean Squared Error (RMSE), were used to evaluate model performance. The ARIMA and RF models achieved MAPE values of 7.98% and 10.72%, RMSE values of 586.67 and 46.48, and MAE values of 475.27 and 32.80, respectively. For feature importance, the feature ‘Day’ was identified as the most important feature, followed by ‘Week’, ‘Day No’, ‘Event’, ‘Month No’, ‘Year’, and ‘Status’. This study shows that ARIMA and RF models effectively forecast patient arrivals, achieving good accuracy for both monthly (MAPE 7.98%) and daily (MAPE 10.72%) predictions. Conclusion: The accuracy of both models are comparable to those in other literature. ARIMA may support long-term inventory and budget planning, while RF may assist with daily staffing. The data characteristics highlighted in this study underscore the value of predictive modelling in public primary care and suggest future work that incorporates more features and algorithms for enhanced accuracy.
INTRODUCTION
Pharmacy is typically the endpoint of a patient’s healthcare journey for managing acute or non-communicable diseases (NCDs). With several medications prescribed per person, the work processes are shared by pharmacists and assistant pharmacists in ensuring that the right medication is given to the right patient. Malaysia, through its Ministry of Health (MOH) annual report, has stated that the number of outpatient prescriptions in Malaysia public health institutions increased by 19.9% to 61.6 million prescriptions [1] in 2024, up from 51.7 million prescriptions in 2023 [2].
The rising volume of patient arrivals directly impacts pharmacy operations, as each arrival represents a time-intensive clinical encounter. Pharmacy services are usually provided in a consistent manner and are expected to adhere to the allocated 30-minute waiting time [1]. Challenges arise when the increasing patient volume outpaces staffing levels, as pharmacy personnel are responsible not only for direct patient care but also for administrative, logistical, compounding, and clinical duties. Inadequate human resource allocation can disrupt consistent medication delivery, exacerbate staff burden, and ultimately compromise service quality. Therefore, forecasting daily patient volume is crucial to ensure proper staffing and efficient allocation of resources, helping to maintain consistent and safe pharmacy services.
Currently, there is limited evidence of a systematic mechanism for predicting total patient arrivals within the Malaysian local pharmacy setting. In this context, a ‘systematic mechanism’ refers to any organized method that has a consistent pathway for determining an output from given input [3]. For example, organized methods include mathematical analysis that consists of various types of algorithms, such as linear regression, logistic regression, or quadratic functions. This mathematical analysis may fall under the field of machine learning, which can be defined as an algorithm that learns and adapts without following explicit instructions in analysing data and its patterns. Some machine learning algorithms are used to build predictive models, and one model may outperform another when using the same data. Sometimes, a study employs several algorithms to determine which model produces the lowest error value. A study by Sirisha et al. [4] used both Autoregressive Integrated Moving Average (ARIMA) and Seasonal Autoregressive Integrated Moving Average (SARIMA), as well as Long Short-Term Memory (LSTM), in forecasting profit, resulting in predicted accuracies of 93.84%, 94.39%, and 97.01%, respectively, indicating that LSTM has the highest accuracy among them. In the healthcare field, time-series forecasting has been used to predict patient arrivals in Emergency Departments (ED), as demonstrated by Porto et al. [5], who used six machine learning algorithms, including Light Gradient Boosting Machine (LightGBM), Support Vector Machine with Radial Basis Function (SVM-RBF), Neural Network Autoregression (NNAR), Random Forest (RF), Extreme Gradient Boosting (XGBoost), Lasso, and Elastic-Net Generalized Linear Model (GLMNET). Interestingly, none of the machine learning algorithms used in this study are specifically time-series forecasting algorithms, yet they were applied in that context.
Despite the widespread adoption of machine learning in modern healthcare services, including diagnostics and disease management, its utilization in Malaysia remains limited, particularly within the pharmacy sector. Chang et al. [6] mentioned barriers such as limited infrastructure, a lack of standardized electronic health records, and varying levels of digital literacy among healthcare professionals as reasons for the slow uptake of machine learning in the pharmacy field. This lack of usage prevents pharmacies from gaining insights from data that could benefit the pharmacy ecosystem, such as patient arrival data. This data can be utilized to develop predictive models for patient arrivals, thus optimizing the allocation of human and inventory resources and improving patient care management. Given the limited utilization of machine learning in this field and the lack of available studies that utilize patient arrival data, this paper will present the first study to develop predictive modelling using patient arrival data in Malaysia’s MOH pharmacy. Therefore, the primary objective of this study is to explore ARIMA/SARIMA and RF in building a predictive model for patient arrivals at the Lukut Health Clinic Pharmacy Unit.
METHOD
Data on total daily patient was collected from Lukut’s Pharmacy unit Queue Management System (QMS). The data spans from 1 January 2023 to 31 October 2025. The inclusion criteria encompass all patients utilizing outpatient pharmacy services at Lukut’s health clinic, while the exclusion criteria include patients who use Value-Added-Service (VAS) Pharmacy, such as ‘Ubat Melalui Pos’ (UMP) and Drive-Through-Pharmacy (FDT). A total of 1,034 data points was collected. Figure I shows the overall methodology process used.
Data analysis was performed using Python version 3.14.0, with the Panel Data and Series (Pandas) library version 2.3.3 employed for data management (i.e., cleaning). Model development and evaluation were conducted using the scikit-learn library version 1.7.2, while the Matplotlib library version 3.10.0 was used for all visualization tasks. The entire analytical process was executed using Jupyter Notebook 7.5.
First, data pre-processing involved cleaning incomplete values and standardizing date formats for programmatic compatibility. Feature engineering in this process included the creation of new features (i-iv) and One-Hot-Encoding for categorical features (i.e., Day, Status). One-Hot- Encoding is used to avoid any assumption that one value is superior to another (i.e., 1 and 2). Secondly, data splitting was performed. The data features were divided into training features and target features. The training set was used to train the model, while the test set was used to validate the model trained on the training set. The data was split using a time series train-test split, with data points from 1 January 2023 to 31 December 2024, used as the training set, while data points from 1 January 2025 to 31 October 2025 used as the test set.
| Features | Data description | Data type |
| Date | Date | Date time |
| Day | Monday – Sunday | Categorical |
| Day No | 1 – 28/29/30/31 | Discrete |
| Month No | 1 – 12 | Discrete |
| Year | 2023 – 2025 | Discrete |
| Status | WeekendWorking Day | Categorical |
| Event | School holidayNo School Holiday | Categorical |
| Set | Description | Time Series Train-Test Split |
| Target | Total Patient | |
| Features | Day, Day No, Week, Month No, Year, Event, Status | Train set: 1 January 2023 – 31 December 2024 Test set: 1 January 2025 – 31 October 2025 |
Thirdly, model training was conducted. Two algorithms were employed: ARIMA/SARIMA and RF Regressor. ARIMA/SARIMA is a time-series-based forecasting method commonly used to forecast data with time series features. To implement this algorithm, it is essential first to ensure that the time series data is stationary, as ARIMA-based models assume that statistical properties such as mean and variance remain constant over time. Stationarity can be assessed using the Augmented Dickey-Fuller (ADF) test, which tests the null hypothesis that a unit root is present in the series. If the ADF test indicates non-stationarity, differencing techniques may be applied to stabilize the mean and variance. Once stationarity is achieved, the next step involves identifying the optimal model parameters, p (autoregressive order), d (degree of differencing), and q (moving average order), for ARIMA, or additionally P, D, Q, and m for SARIMA to account for seasonality. These parameters can be determined through the analysis of Autocorrelation Function (ACF) and Partial Autocorrelation Function (PACF) plots or through automated optimization techniques such as grid search using information criteria like the Akaike Information Criterion (AIC) or the Bayesian Information Criterion (BIC). In this case, Gridsearch Cross Validation (GridsearchCV) was used. The model was then trained using the historical data and evaluated through residual diagnostics to ensure the errors are white noise, confirming that the model adequately captures the underlying time-series patterns.

A RF model was chosen as an additional predictive model alongside ARIMA/SARIMA. RF is an ensemble learning algorithm that constructs multiple decision trees during training and combines their results (through averaging) to produce a more accurate and stable prediction. It is particularly effective for regression tasks involving non-linear relationships and mixed data types. The hyperparameters of each model were tuned using Pyramid Arima (pmdarima) for ARIMA/SARIMA and GridSearchCV for RF. This process optimizes the model by systematically testing multiple combinations of hyperparameters to identify the set that yields the best results. GridSearchCV employs a 10-fold cross-validation approach, meaning the training data is split into ten equal parts. The model is trained on nine parts and validated on the remaining one, repeating this process ten times. The results are averaged to provide a reliable estimate of model performance and help identify the optimal parameter combination. The output of this step is the best-tuned Random Forest model, which is then used for predictions on the test data.
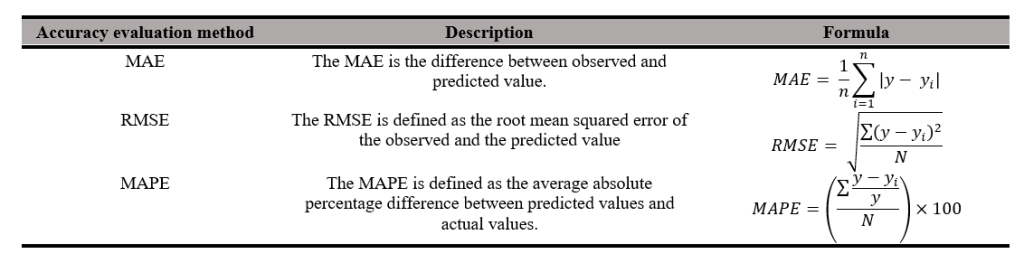
Lastly, model evaluation was conducted. After training both models, their performance was evaluated using appropriate forecast accuracy metrics, such as Mean Absolute Error (MAE) and Root Mean Squared Error (RMSE). MAE is defined as the mean total differences between the observed and predicted values. However, a limitation of MAE is that it is difficult to compare across models of different scales. Hence, we also used Mean Absolute Percentage Error (MAPE). Unlike other error measures, MAPE is scale-independent, allowing for fair comparisons across different datasets. Overall, it provides a clear and standardized way to assess and compare the performance of forecasting models. Rather than a direct head-to-head comparison between the two models, this study evaluates the independent utility of a statistical approach (ARIMA) for macro-level monthly forecasting and a machine learning approach (Random Forest) for micro-level daily forecasting. The performance of each model will be discussed in relation to existing literature to highlight how different mathematical frameworks capture temporal dynamics at varying administrative scales.
RESULT
1. Data Characteristics
1.1. Data Plot Visualization
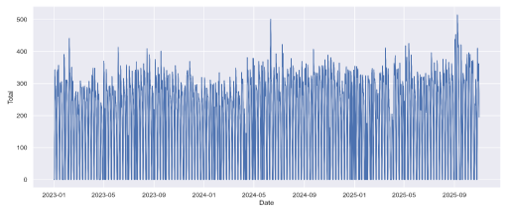
The historical data of patient arrivals from 2023 to the end of 2025 is presented in Figure II. This figure plots all 1,034 data points, including those with zero patient arrivals. From this data, we cannot infer any trends or seasonal aspects of patient arrival characteristics due to the high density and daily volatility of the 1,034 raw data points. Macro-level trends and subtle seasonal cycles are difficult to discern through visual inspection of Figure II alone. The highest and lowest values of daily patient arrivals are 514, recorded on September 8,2025, and 124 on February 28, 2025, respectively.
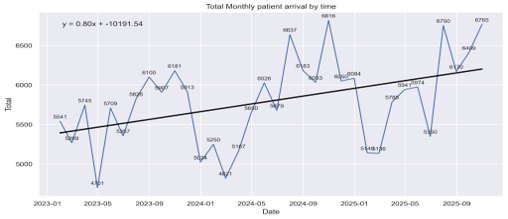
For ease of data characterization, the 1,034 data points have been aggregated by month and plotted against time, as shown in Figure III. In this figure, the data appears to exhibit an increasing trend over the years, with the lowest and highest monthly arrivals being 4,701 and 6,816, respectively. Furthermore, a linear regression line has been plotted with the equation y = 0.80x -10,191.54, indicating an increment in patient arrivals over the years. Total patient arrivals were 71,297 in 2023, 75,109 in 2024, and 76,917 in 2025. This represents a 5.08% increase (n=3,812) in 2024 compared to 2023, and a 2.35% increase (n=1,808) in 2025 compared to 2024. For context, Lukut outpatient pharmacy has only 5 permanent and 3-4 contract staff.
2. ARIMA/SARIMA
2.1. Data Stationarity The data underwent the ADF test to assess its stationarity. The ADF test is based on the following hypothesis: the null hypothesis states that the data is non-stationary and that a unit root is present, while the alternative hypothesis posits that the data is stationary and has no unit root. With a p-value of 0.013, the null hypothesis is rejected, indicating that the data is stationary and has no unit root. Thus, the data does not require any differencing process.
2.2. ACF and PACF plot
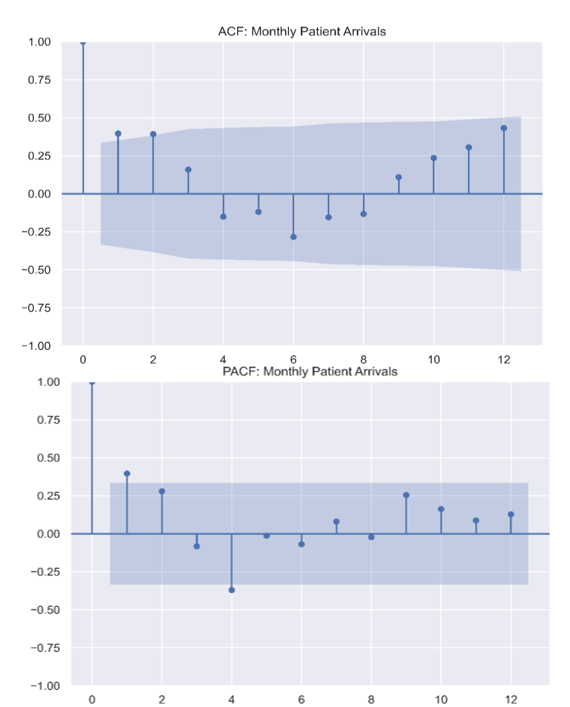
ACF and PACF plots were used to determine the p and q orders of the ARIMA/SARIMA model, as displayed in Figure IV. In the ACF plot, there is a significant spike at the first lag, followed by a sharp cut-off at the second lag and gradual decay. The ACF plot also shows a sinusoidal wave pattern which indicates seasonality or cyclical patterns, implying that there is a fixed occurrence.
The PACF plot clarifies the direct relationship between specific time lags after removing the effects of intermediate lags. The PACF demonstrates a sharp cut-off after the first lag, with a significant positive spike at lag 1 that extends beyond the 95% confidence interval represented by the blue shaded region. Most subsequent lags fall within the significance bounds, although a minor negative correlation is observable at lag 4. This “significant spike at lag 1 followed by a cut-off” signature is characteristic of an autoregressive process of order 1 (AR (1)).
These observations suggest that the SARIMA order is best modelled using an autoregressive approach. The combination of the tapering, wave-like ACF and the abrupt cut-off in the PACF validates the selection of a SARIMA model, confirming the need to account for both immediate autoregressive trends and broader seasonal cycles to accurately predict future pharmacy resource demands.
| Stationarity test | Value | P-Value |
| Augmented Dickey – Fuller (ADF) Test | -3.323 | 0.013 |
| Metrics | Value |
| MAE | 475.27 |
| RMSE | 586.67 |
| MAPE | 7.98% |
| Coefficient of Variation (CV) | 0.0946 (<10%) |
| Cycle | 34 months /12 months = 2.8 |
2.3. ARIMA Accuracy Metrics
The sample data used in this model consisted of monthly patient arrival data, as daily patient arrival data require a high level of computing power for analysis. Despite the ACF and PACF plots, we used pmdarima to fine-tune our hyperparameters. It identifies the optimal set of hyperparameters by minimizing an information criterion, such as the AIC or BIC, resulting in the best-fit model for the time series data. This automated process identified the optimal ARIMA order as (1,0,2) (0,0,0,12).
Despite the ACF plot showing seasonal patterns at lag 12, pmdarima did not select a SARIMA model, likely due to data sparsity and low variance. The data underwent further analysis, and the Coefficient of Variation (CV) resulted in 0.0946 which indicate low variance. The limited number of samples produced only 2.8 cycles. Seasonal unit-root tests employed by pmdarima require longer time series with sufficient seasonal signals to achieve adequate statistical power. If these conditions are not met, the tests tend to default to no seasonal differencing. As a result, the automatic procedure selected a non-seasonal ARIMA model [7].
The accuracy metrics of the model are described in Table V. The analysis yielded an MAE of 475.27, representing the average absolute deviation between forecasted and actual monthly patient counts. The RMSE was calculated at 586.67, which, being higher than the MAE, indicates the presence of occasional larger forecasting errors or seasonal outliers. Despite these variances, the model achieved a MAPE of 7.98%. In the context of healthcare operations, a MAPE below 10% is considered highly robust, thus validating the model’s ability to capture complex seasonal patterns. This <10% accuracy is supported by the statement from Lewis et al. [8] and further backed by studies such as Yang et al. [9] which affirm Lewis et al. [8] statement as the gold standard for ARIMA.
| Metrics | Value |
| MAE | 32.80 |
| RMSE | 46.48 |
| MAPE | 10.72% |
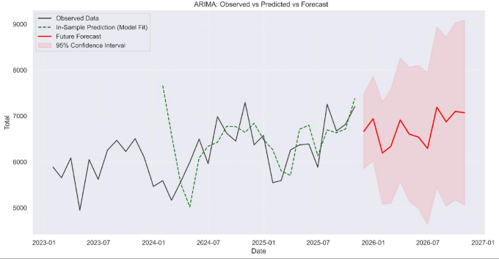
2.4. ARIMA Model Visualization
In this study, we use pmdarima to identify the order of the model. From this, we determined that the most optimal ARIMA order is (1,0,2) (0,0,0,12). According to Figure V, the actual observed data from early 2023 to late 2025 reveals a clear upward trend in patient arrivals, while the in- sample prediction plot closely mirrors the actual observed values. This signifies the model’s low MAPE of 7.98%. A forecast for 2026 has been plotted, projecting a continued upward trajectory with defined seasonal peaks. The inclusion of a 95% confidence interval provides a visual representation of uncertainty, as shown by the RMSE of 586.67. This plot demonstrates that the ARIMA model is a statistically robust fit for the data.
3. Random Forest
3.1. Random Forest Accuracy Metrics
The sample data used in this model consisted of daily patient arrival data, and we used Random Forest. The accuracy metrics of the model are described in Table VI. The predictive performance of the Random Forest model for patient arrivals at Lukut Health Clinic Pharmacy was evaluated using three standard metrics. The MAE was calculated at 32.80, representing an average daily deviation of approximately 33 patients. The RMSE reached 46.48, indicating sensitivity to occasional large forecasting errors. This discrepancy between RMSE and MAE highlights the presence of outliers, likely caused by unpredictable surges in patient volume. Despite these spikes, the model achieved a MAPE of 10.72%. There is no universal definition or categorisation regarding what level of MAPE is considered good, as it is relative. An error margin of roughly 10% is considered robust for a daily healthcare system in which human behaviour is unpredictable, as cited by Lewis et al. [8] and further supported by Boyle et al. [10], who found a MAPE level of 11% in his Emergency Department (ED) patient arrivals.
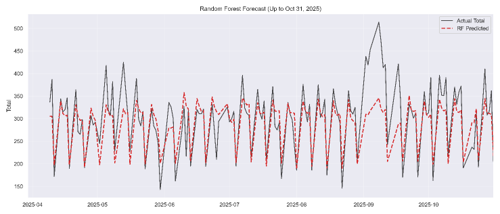
3.2. Random Forest Model Plot and Feature Importance Visualization
Figure VI shows the Random Forest model plot, where observed and predicted data points are plotted against the time period from April to October 2025. Generally, the model can track the rhythm of the data. The red dashed line closely follows the black line during periods of moderate volatility, particularly in the early months of the series, from April through June. This suggests that the model has successfully learned the cyclical nature of the dataset, likely identifying features that influence the “Total.”
Several observed outliers are plotted in Figure VI and the model provides an underfitting predicted value of patient arrivals. This can be seen during the period from the start of September 2025. This sudden spike suggests the model’s inability to predict values based on the features, as RF Regression makes predictions by averaging the outcomes of multiple decision trees. Thus, it struggles with extreme outlier values that exceed previous patient arrival records.
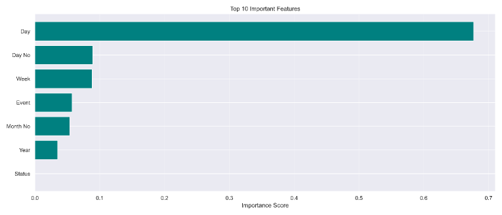
Figure VII shows the top important features contributing to the model’s decisions. With reference to the study by Menze et al. [11], we use the threshold definition of the Gini Coefficient to describe feature importance. The feature ‘Day’ holds the highest importance score, exceeding 0.6 or 60%, confirming that it is a dominant feature. Features such as ‘Week’ and ‘Day No’ are significant, hovering above 0.1 or 10%. However, ‘Year’, ‘Month No’, and ‘Event’ have values below 0.1 or 10%, indicating they are relatively minor features. The ‘Status’ feature failed to contribute to the RF model.
DISCUSSION
This study provides significant findings regarding patient arrival at the Lukut Health Clinic Pharmacy unit. Lukut is a township under the Port Dickson district, and the Lukut Health Clinic is the only public primary care service in the township. Firstly, in terms of the data characteristic plot, we identified a gradual increasing trend in patient arrivals at Lukut Health Clinic Pharmacy, as shown in Figure III. This trend is likely multifactorial; for instance, population growth directly correlates with higher outpatient volumes [12]. Urbanization leads to higher population density, accelerating the transmission of communicable diseases and thereby increasing the number of patients seeking treatment [13]. Compounded by the rising prevalence of non-communicable diseases (NCDs) in Malaysia, these demographics drive high patient arrivals [14]. Wyatt et al. [12] mathematically confirmed that raw population growth is a primary driver of growth in outpatient attendances. Contextually, the Port Dickson district [15] is among the districts with a high population growth rate of 0.9% and 0.3% in 2024 and 2025, respectively. Additionally, macroeconomic factors, such as rising insurance premiums, make healthcare less-accessible, consequently forcing the public to rely on government intervention and public healthcare facilities as their primary safety net [16]. Thus, no single factor can be attributed to the rising patient arrivals at Lukut Health Clinic.
The ACF plot further indicates a distinct seasonal aspect. Patient arrivals at the pharmacy show a recurring yearly pattern, with approximately similar volumes observed in the same months across consecutive years. This suggests that the demand for pharmacy services is influenced by factors that repeat on a yearly cycle rather than random variation. This is probably due to patients with NCDs regularly having medical appointments throughout the year, depending on institutional dispensing policies. Wang et al. [17] supported this notion, but factors such as climatic variables, seasonal disease patterns, and cultural festivities may also drive this variance, as stated by several studies [5, 18, 19]. Because this study’s features are limited to calendrical data, the model cannot isolate other confounding factors affecting patient arrivals.
Another main finding is that the ARIMA model for monthly arrival and the RF model for daily arrival achieved MAPE levels of 7.98% and 10.72%, respectively. These two models are used in parallel to estimate monthly and daily patient arrivals at the pharmacy. Few similar methodological studies have been conducted in an outpatient pharmacy setting. Studies such as Vollmer et al. [20] used outpatient emergency departments (ED) and found a lower MAPE of 6.9% – 9.1% for their Random Forest model, while Cao et al. [21] found a MAPE value of 7.3% for their daily predictive models. This lower MAPE value compared to ours is partially due to the high dimensionality of the features set in their RF model. For instance, Vollmer et al. [20] used 30 features, including minimum/maximum temperatures, precipitation, and flu hits on Google on from the previous day, which were not available in our study, and these features ranked high in the study’s feature importance. RF works well with non-linear data, where high-dimensional data often correspond to non-linear trends. In predictive modelling, there are no universally established benchmarks that define a ‘good model’. Yang et al. [9] mentioned that ensemble models like RF are considered highly successful when they maintain a MAPE near 10%, while Riley et al. [22] state that RF models with a MAPE of around 10-15% are considered good because healthcare ecosystems are inherently unpredictable. Thus, even with limitations such as fewer samples and a smaller number of features, the study’s RF model may be a reliable tool for forecasting patient arrivals.
The ARIMA model produced an MAE of 475.27, indicating a monthly forecast error of approximately 475 patients. The average patient arrival per month at the Lukut outpatient pharmacy is 5,964, and considering the MAE value of 475.27 and MAPE of 7.98%, it is considered a good predictive model. The pharmacy unit can use the conservative estimate of RMSE of 586.67, to establish a stock buffer, ensuring continuity of patient medication supply. Evidence from Mohamed et al. [23] produced a MAPE value of 11.10% using orthopaedic data from a private hospital with an order of (1,1,0). Peerawong et al. [24] interestingly used pmdarima and found that the most suitable order is (1,0,2) (0,0,0,12) and produced a MAPE value of 7.2%, which is comparable to ours. Jiang et al. [25] discussed several studies involving Recurrent Neural Network (RNN) and ARIMA/SARIMA, noting that most ARIMA studies’ MAPE values range between 3% and 13%, placing our ARIMA MAPE within this range. Thus, this model can be a reliable method for predicting monthly patient arrivals or for use in stock management; for example, the RMSE value of 586.67 can be used as a buffer stock for high-usage medications such as paracetamol or diphenhydramine syrup, as the RMSE accounts for outlier values in the historical data.
The ‘Day’ feature (Monday – Sunday) is the most important feature in the RF model, making it a strong predictive component of patient arrivals. Vollmer et al. [20] support this finding, as most of the important features in their study are day-related. However, this contrasts with findings by Antczak et al. [26], who stated that feature importance of a model often shifts based on unit speciality. While unpredictable events, such as traffic accidents, might drive feature importance in an emergency department, outpatient pharmacy arrivals are primarily driven by routine medication collection, making the day of the week highly predictive. Furthermore, institutional dispensing policies might contribute to feature importance, as some pharmacies dispense one or two or even a full supply of medication for the patients, thus heavily influencing daily patient arrivals at the pharmacy.
The ‘Event’ feature (School holiday – No School Holiday) demonstrated low importance, likely because the Lukut Health Clinic, as a public institution, is closed during government-gazetted holidays. Liu et al. [27] contradict this study, citing that event-related features have high importance in the model. This low feature importance may occur because the binary variable fails to capture lagged post-holiday effects, such as ‘1 day after celebration’ or ‘2 days after celebration’ or even ‘a week after celebration’. These post-holiday lag effects are critical, as patients frequently defer routine medication collection and clinical check-ups during festive periods, creating operational bottlenecks upon reopening [28].
The ‘Status’ feature (Working Day – Weekend) yielded zero predictive importance, which is a mathematical consequence of severe multicollinearity; because the clinic is closed on weekends, the ‘Weekend’ feature perfectly mirrors zero patient arrivals. Furthermore, the information of the ‘Status’ feature may also be similar to the ‘Day’ feature, which contains values for Monday – Sunday. Since the Lukut Health Clinic is closed on weekend (Saturday and Sunday), this can be demonstrated with Cramer’s V, which produces a result of (V = 0.998, p < 0.001), indicating that the two features are strongly associated with each other, leading the RF model to drop the redundant feature entirely [29].
Limitations of the Study
The limitations of this study are as follows: Firstly, there is sparse data available for use as features in this study. This study only utilized calendar characteristics as its features, which limited the scope of observation to temporal trends and excluded external factors such as weather or flu season. Furthermore, because the Random Forest dataset relied exclusively on calendar variables without integrating autoregressive lagged targets (e.g., patient volumes from prior days), the model functions as a static calendar regression rather than a dynamic time-series forecaster capable of adjusting to recent residual trends.
Secondly, the QMS may experience internal problems, rendering the system unusable. Hence, the actual number of patients may not be registered in the system. Furthermore, personnel errors may also affect the study, such as staff entering incorrect numbers for patient arrivals.
Lastly, even if weather data were available, its applicability is limited, as the weather station is located in Port Dickson town, approximately 9.4km away from the Lukut Health Clinic. It is often reported by the station that if it rains in Port Dickson as a district, it may only mean rain in the Port Dickson town area, not in Lukut. Hence, the weather data may be more suitable for use in the Port Dickson Health Clinic compared to Lukut’s.
CONCLUSION
In summary, this study has addressed the limited application of predictive modelling in the Malaysian pharmacy sector by developing and evaluating machine learning models for forecasting patient arrivals at the Lukut Health Clinic Pharmacy. The study explored the performance of both ARIMA and RF while also characterizing patient arrival data, which shows an upward trend. The models‒ ARIMA and RF ‒ achieved satisfactory forecasting performance for monthly and daily patient arrivals, respectively. The findings indicate that routinely collected operational data, such as QMS, can be transformed into valuable insights that may help resource planning. In practice, ARIMA may assist with longer-term inventory, budgeting, and service planning, while RF may support daily workforce allocation and workload management. Despite these contributions, the study is limited by the use of data from a single health clinic and a feature set largely restricted to calendar-based variables, which may not fully capture external factors influencing patient attendance. Future research should evaluate these models using multi-centre datasets and incorporate additional predictors such as meteorological data and disease prevalence. Future studies should also explore utilising other machine learning and deep learning approaches, such as XGBoost, LSTM, and hybrid forecasting models. Further studies are needed to validate the RF model in high-dimensionality data. This may further improve predictive accuracy and enhance the applicability of predictive analytics in pharmacy service management.
ACKNOWLEDGEMENT
The authors would like to express their sincere gratitude to Dr. Nurainul Hani, Family Medicine Specialist (FMS) at Lukut Health Clinic, and Puan Rosmaliza, Chief Pharmacist of the Port Dickson Health District, for providing approval for this study.
CONFLICT OF INTEREST
Author Muhammad Amru Bin Nazri and Author Nur Najwa Azureen Binti Mohd Azhar are spouses and collaborated on this study as co-authors. The authors declare that there are no conflicts of interest.
REFERENCE
- Malaysia KK. Laporan Tahunan Program Perkhidmatan Frmasi 2024. Kementerian Kesihatan Malaysia; 2024. Report No.: EISSN 2735-1254.
- Malaysia KK. Laporan Tahunan Program Perkhidmatan Farmasi 2023. Kementerian Kesihatan Malaysia; 2023. Report No.: MOH/f/far132.24(ar)-e.
- Hastie T, Tibshirani R, Friedman J. The elements of statistical learning: data mining, inference, and prediction. 2nd ed. New York: Springer 2009. https://doi.org/10.1007/978-0-387-84858-7
- Sirisha UM, Belavagi MC, Attigeri G. Profit prediction using ARIMA, SARIMA and LSTM models in time series forecasting: a comparison. IEEE Access 2022; 10: 124715–124727. https://doi.org/10.1109/ACCESS.2022.3224938
- Porto BM, Fogliatto FS. Enhanced forecasting of emergency department patient arrivals using feature engineering approach and machine learning. BMC Med Inform Decis Mak 2024; 24(1): 377. https://doi.org/10.1186/s12911-024-02788-6
- Chang CT, Wong YJ, Thum CC, Chan HK. Embracing artificial intelligence in Malaysian pharmacy practice: current landscape and future directions. Mal J Pharm 2025; 11(1): 1–3. https://doi.org/10.52494/maljpharmv11101
- El Montasser G. The seasonal KPSS test: examining possible applications with monthly data and additional deterministic terms. Econometrics 2015; 3(2): 339–354. https://doi.org/10.3390/econometrics3020339
- Lewis CD. Industrial and business forecasting methods: a practical guide to exponential smoothing and curve fitting. London: Butterworth Scientific 1982.
- Yang P, Cheng P, Zhang N, Luo D, Xu B, Zhang H. Statistical machine learning models for prediction of China’s maritime emergency patients in dynamic: ARIMA model, SARIMA model, and dynamic Bayesian network model. Front Public Health 2024; 12: 1401161. https://doi.org/10.3389/fpubh.2024.1401161
- Boyle J, Jessup M, Crilly J, Green D, Lind J, Wallis M, et al. Predicting emergency department admissions. Emerg Med J 2012; 29(5): 358–365. https://doi.org/10.1136/emj.2010.103531
- Menze BH, Kelm BM, Masuch R, Himmelreich U, Bachert P, Petrich W, et al. A comparison of random forest and its Gini importance with standard chemometric methods for the feature selection and classification of spectral data. BMC Bioinformatics 2009; 10(1): 213. https://doi.org/10.1186/1471-2105-10-213
- Wyatt S, Hobro G, Seamer P, Mohammed MA, Spilsbury P. Decomposing the effects of changes of population size, age-sex profile, health status and residual factors on growth in hospital activity in English hospitals: an ecological database study from 2011–2019. BMC Health Serv Res 2025; 25(1): 1601. https://doi.org/10.1186/s12913-025-13662-0
- Alirol E, Getaz L, Stoll B, Chappuis F, Loutan L. Urbanisation and infectious diseases in a globalised world. Lancet Infect Dis 2011; 11(2): 131–141. https://doi.org/10.1016/S1473-3099(10)70223-1
- Institute for Public Health. National Health and Morbidity Survey 2023: non-communicable diseases and healthcare demand. Shah Alam: Institute for Public Health, National Institutes of Health, Ministry of Health Malaysia 2024.
- Department of Statistics Malaysia. Current population estimates, administrative districts, 2024. Putrajaya: Department of Statistics Malaysia 2024.
- Ashraf A, Ong SC. Malaysia healthcare system: protect the public or the industry? Health Promot Perspect 2021; 11(2): 117–118. https://doi.org/10.34172/hpp.2021.16
- Wang Y, Chen J, Zhou Q, Kang S, Jiang Y, Xiang J, et al. Time series analysis of low-concentration air pollution and hospital respiratory disease outpatient visits. Front Public Health 2025; 13: 1585086. https://doi.org/10.3389/fpubh.2025.1585086
- Fan B, Peng J, Guo H, Gu H, Xu K, Wu T. Accurate forecasting of emergency department arrivals with internet search index and machine learning models: model development and performance evaluation. JMIR Med Inform 2022; 10(7): e34504. https://doi.org/10.2196/34504
- Tabesh H, AbbaszadehMozaffari A, Ebnehoseini Z, Saki A. Enhancing the forecast accuracy of the daily number of patient arrivals in emergency department by hybrid ARIMAX-ANN algorithm. PLoS One 2026; 21(4): e0347866. https://doi.org/10.1371/journal.pone.0347866
- Vollmer MAC, Glampson B, Mellan T, Mishra S, Mercuri L, Costello C, et al. A unified machine learning approach to time series forecasting applied to demand at emergency departments. BMC Emerg Med 2021; 21(1): 9. https://doi.org/10.1186/s12873-020-00395-y
- Cao L, Zhang L. Daily hospital outpatient visits prediction based on seasonal autoregressive integrated moving average model. medRxiv [Preprint] 2025. https://doi.org/10.1101/2025.04.15.25325872
- Riley RD, Collins GS. Stability of clinical prediction models developed using statistical or machine learning methods. Biom J 2023; 65(8): e2200302. https://doi.org/10.1002/bimj.202200302
- Mohamed B, Mohamad M. Forecasting patient admission in orthopedic clinic at a hospital in Kuantan using autoregressive integrated moving average (ARIMA) models. J Phys Conf Ser 2020; 1529(5): 052090. https://doi.org/10.1088/1742-6596/1529/5/052090
- Peerawong T, Chaichulee C, Sangsupawanich P. Forecasting daily radiotherapy patient volumes in a tertiary hospital using autoregressive integrated moving average (ARIMA) models. Cureus 2024; 16(10): e72752. https://doi.org/10.7759/cureus.72752
- Jiang S, Liu Q, Ding B. A systematic review of the modelling of patient arrivals in emergency departments. Quant Imaging Med Surg 2023; 13(3): 1957–1971. https://doi.org/10.21037/qims-22-268
- Antczak J, Montgomery J, O’Reilly M, Palmowski Z, Turner R. Early predicting of hospital admission using machine learning algorithms: priority queues approach. arXiv [Preprint] 2026: arXiv:2601.15481. https://doi.org/10.48550/arXiv.2601.15481
- Liu X, Gu F, Bai Z, Huang Q, Ma G. Forecasting of daily outpatient visits based on genetic programming. Iran J Public Health 2022; 51(6): 1313–1322. https://doi.org/10.18502/ijph.v51i6.9676
- He G, Cai M, Meng R, Hu J, Peng K, Hou Z, et al. The Spring Festival is associated with increased mortality risk in China: a study based on 285 Chinese locations. Front Med (Lausanne) 2022; 9: 761060. https://doi.org/10.3389/fmed.2022.761060
- Molnar C. Interpretable machine learning: a guide for making black box models explainable. Lulu.com 2020.
Please cite this article as:
Muhammad Amru Bin Nazri, Nur Najwa Azureen Binti Mohd Azhar, Muhammad Adib Aqmal Bin Md Idris and Nur Dayana Binti Ali Sabri, Predictive Modelling of Patient Arrivals Using Machine Learning at Lukut Health Clinic Pharmacy. Malaysian Journal of Pharmacy (MJP). 2026;2(12):69-77. https://mjpharm.org/predictive-modelling-of-patient-arrivals-using-machine-learning-at-lukut-health-clinic-pharmacy/