Abstract
Background: Type 2 diabetes mellitus and prediabetes are showing an increasing number of cases and are predicted to keep increasing over the years. Both conditions have a 2-3-fold increased risk of developing cardiovascular diseases. Intermittent fasting is one of the forms of dietary intervention being practiced in preventing and managing these conditions and their associated complications. There are many reported benefits of intermittent fasting for health, but no specific studies discussed regarding the effect of this practice on cardiovascular health of these patients. Objective: This study is aiming to systematically review the benefits of intermittent fasting on cardiovascular health of these groups of patients. Methods: This systematic review followed the guideline of PRISMA and was registered at PROSPERO with the registration number of CRD42022378349. A systematic literature search was conducted in PubMed, Scopus, Cochrane Library, Google Scholar and by using snowball technique. The articles retrieved were independently screened by two authors against the eligibility criteria in stages of title, abstract and full text. The risk of bias in the included studies were assessed independently by two authors using the Joanna Briggs Institute critical appraisal checklist. Data from all the included articles were extracted using a predetermined template. Results: Twelve studies were included in this study. Six studies recorded low risk of bias while the other six studies had moderate risk of bias. Three studies recorded significant reduction for both systolic and diastolic blood pressure, and 3 studies showed significant improvement in the lipid profiles at the end of intervention. Conclusion: Intermittent fasting is beneficial for cardiovascular health of prediabetes and type 2 diabetes mellitus patients mainly by improving both systolic and diastolic blood pressure and the lipid profiles. Randomized controlled trials that investigate specifically the benefits of this practice on the cardiovascular health of these populations are needed to confirm the findings.
Introduction
Diabetes mellitus is one of the chronic diseases that has high prevalence worldwide. In 2021, there are 537 million (10.5%) adults living with diabetes worldwide and this number is predicted to increase to 643 million by 2030 [1]. In Malaysia, there are about two million (9.4%) adults aged 18 years and above are diagnosed with diabetes as of 2019, increased 1.1% compared to what have been reported in year 2015 (8.3%) (National Health Morbidity Survey, 2019). The fact that the
number of diabetes patients will increase by years is very worrying as it costs a huge socio-economic burden due to increased mortality because of accelerated vascular complications and premature death [2]. It is estimated that the total annual cost of diabetes in Malaysia is USD 600 million (RM 2.6 billion) which covers the direct, indirect, intangible, capital, recurrent and per diem costs [3]. The International Diabetes Federation (IDF) in their most recent research reported that 352 million adults between the ages of 20 and 79 (or 7.3% of the population) may have prediabetes. This figure is expected to increase to 481 million by 2040. Compared to Malaysia, the report from National Health Morbidity Survey (NHMS) 2019 reported that the prevalence of those with abnormal fasting plasma glucose (FPG) was 23.6% at the time of the survey. This means that there are approximately 5 million individuals in Malaysia with probable prediabetes in Malaysia and future risk of developing diabetes. Prediabetes is defined by blood glucose levels that are higher than normal but fall short of the diagnostic criteria for Type 2 diabetes mellitus (T2DM) [4]. People with prediabetes have a 30% chance of developing T2DM over a 10-year period [5].
It is well established that patients with prediabetes and T2DM will commonly have other coexist non-communicable diseases such as obesity and have a 2-3-fold increased risk of developing cardiovascular diseases (CVD) like hypertension and dyslipidemia. Thus, it is very important to assess the CV profile of the patients at the time of diagnosis and during each clinic visit to prevent the development and progression of the any CVD. Patients may present with CVD such as peripheral arterial disease, heart failure, angina, and non-fatal myocardial infarction [6]. In the National Diabetes Registry Report (2020), it was reported that 80%, 75.7% and 84% of T2DM patients are also diagnosed with hypertension, dyslipidemia, and obesity, respectively. In addition, Newman et al. (2017) reported that the most common cause of death among adults with T2DM is due to cardiovascular diseases [7]. This is proven where 60% of patients with T2DM will eventually die from cardiovascular (CV) complications [2].
Currently there are many strategies being practiced for managing prediabetes and T2DM patients, pharmacologically and non-pharmacologically. Oral hypoglycemic agents (OHA) such as metformin and gliclazide and insulin therapy are used as one of the pharmacological treatments for T2DM patients. Besides, non-pharmacological intervention such as medical nutrition therapy (MNT), exercise, and tobacco cessation also help to prevent and manage prediabetes and T2DM [2]. In addition, weight management is also essential in the management of prediabetes and T2DM patients as obesity is one of the main factors that contribute to the development of T2DM. This is because, excess adipose tissue in obese patients cause an increase in the secretion of proinflammatory cytokines such as interleukin 6 (IL-6), synthesis of leptin (a proinflammatory protein) and decrease secretion of adiponectin (an anti-inflammatory protein) which results in a higher ratio of proinflammatory cytokines and protein which are associated with insulin resistance [8]. One of the strategies to reduce body weight is by having daily negative calorie balance or calorie deficit meals [9].
Many clinical practice guidelines and diabetes associations stated that one of the crucial methods in the treatment and prevention of prediabetes and T2DM, and its associated complications is through dietary interventions [10]. Intermittent fasting (IF) is one of the common approaches that is being practiced for reducing the daily calorie intake and as a form of dietary intervention [10][11]. One of the reasons behind it is that IF is a regime that could be tolerated by majority of the people for a long period of time and at repeated intervals as practiced by the Muslim community worldwide during the holy month of Ramadhan yearly and voluntary fasting on Monday and Thursday weekly [12]. According to Abdellatif and Sedej (2020), IF is characterized by dietary restriction for prolonged periods that is interrupted by periods of ad libitum eating [13]. There are several types of IFs being practiced nowadays such as alternate day fasting (ADF) (36 hours of fasting separated by 12 hours ad libitum eating) and time restricted feeding (TRF) (limiting intake of food for several hours within a specific timeframe, around 6 to 12 hours) [14].
There are many reported benefits of IF for health including on the cardiovascular system. For instance, IF is cardioprotective helps to reduce blood pressure and resting heart rate in healthy patients [13][14]. IF also is also reported to help in reducing the body weight [15], enhancing insulin receptors sensitivity [16], and promoting mitochondrial biogenesis, cellular stress resistance and synaptic plasticity due to increased level of brain-derived neurotrophic factor (BDNF) during IF period [17]. However, there are no studies discuss specifically / in depth on the benefits of IF on cardiovascular system T2DM patients. Therefore, this study aims to investigate the benefits of IF on cardiovascular health of prediabetes and T2DM patients by systemically review available published articles and research.
Material and Method
Protocol and registration
The current systematic review followed the statement and general principle of the Preferred Reporting Items for Systematic Reviews and Meta-Analyses (PRISMA) [38] and was registered at the International Prospective Register of Systematic Reviews (PROSPERO) with the number CRD42022378349.
Eligibility criteria
This systematic review examined the intermittent fasting studies with T2DM and prediabetes and the effect of practicing it on their cardiovascular health. To be considered for inclusion within this review, study subjects needed to be aged between 18 to 80 years and have prediabetes or are diagnosed with T2DM. The diagnostic criteria for T2DM according to IDF 2021 are: (1) fasting venous or capillary plasma glucose ≥7.0 mmol/L (126 mg/dL); (2) 2-hour venous plasma glucose after loaded with 75g oral glucose ≥11.1 mmol/L (200 mg/dL); (3) Random plasma glucose in the presence of hyperglycemia symptoms ≥11.1 mmol/L (200 mg/dL); (4) HbA1c ≥ 6.5% (48 mmol/mol). T2DM is diagnosed if one or more of the following criteria are met. For prediabetes, the American Diabetes Association (ADA) recommends diagnosing prediabetes with HbA1c values between 39 and 47 mmol/mol (5.7–6.4%) or impaired fasting glucose when the fasting plasma glucose is between 5.6 and 6.9mmol/L (100–125mg/dL) or 2 hour plasma glucose during 75-g oral glucose tolerance test (OGTT) between 140 mg/dL (7.8 mmol/L) to 199 mg/dL (11.0 mmol/L), known as impaired glucose tolerance (IGT).
Study design was not limited to only randomized controlled trial (RCT) and other study designs such as cohort studies, case series and quasi-experimental studies are also included in the review. However, only studies published in English and between 2000 to 2022 were included to extract data sources. This review excluded studies that included participants who are diagnosed with type 1 diabetes mellitus (T1DM), pregnant or breastfeeding, smokers, active athletes, with history of psychiatric or eating disorders and diagnosed with chronic kidney diseases stage 4 and 5 (eGFR <30 ml/min). Further exclusion criteria include animal or non-human studies and study protocols and review articles. Since many individuals with T2DM are already receiving pharmacological interventions for managing glycemic control, subjects on an oral hypoglycemic agent or insulin were not excluded from the review.
As this review investigated the effects of IF on cardiovascular health of prediabetes and T2DM patients, studies had to include an intermittent fasting intervention, or any regimen associated with intermittent fasting such as ADF or TRF. The primary outcome measure was improvement in total cholesterol (TC), low-density lipoprotein cholesterol (LDL-c), high- density lipoprotein cholesterol (HDL-c), triglycerides (TG), systolic and diastolic blood pressure (SBP and DBP), heart rate (HR) or pulse rate (PR) in the participants. Secondary outcomes included measures of glycemic control and metabolic parameters such as HbA1c, fasting blood glucose (FBG), fasting serum insulin level, and Homeostatic Model Assessment of Insulin Resistance (HOMA-IR). Studies that do not include the targeted primary and secondary outcomes will not be included in this review.
Search strategy
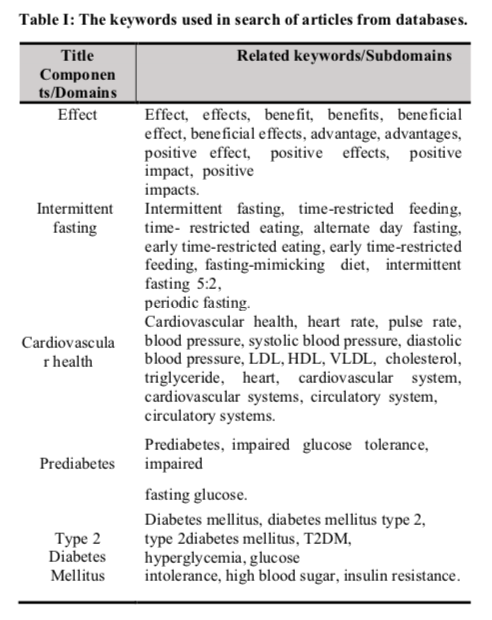
Studies or articles were searched from four databases which include SCOPUS, Cochrane Library, PubMed, and Google Scholar. The search strategy included a combination of domain and sub-domain that were combined with Boolean operators “OR” and “AND”. Keywords within the same domain were connected using Boolean operator “OR” while “AND” operator was used to connect keywords between other domains. The search terms included five main domains from the title of this study in alignment with the inclusion and exclusion criteria which were: (1) effects: list of all keywords that are synonym to effect such as benefits and advantages; (2) intermittent fasting and its associated terms; (3) cardiovascular health: a general term for cardiovascular system and its associated diseases; (4) type 2 diabetes mellitus: a term describing patients who have been diagnosed with T2DM; and (5) prediabetes. The list of keywords that were used for each domain are listed in Table I. Besides, snowball technique, a technique to search for articles from the reference list of articles retrieved from the databases, were also used to add more articles for selection. Results of the search strategy were then added, stored, and managed in Mendeley, including removal of duplicates. Microsoft Excel was used to support document study selection and data extraction.
Study selection
Two authors independently examined the studies against predetermined eligibility criteria in the stages of title, abstract, and full-text study selection. None of the screening authors were blinded to any details of the studies. Two independent authors independently reviewed study titles and abstracts until convergence was reached. Discrepancies were then discussed between the two authors and if an agreement was not met between the authors, the discrepancies were then discussed with the third author and criteria refined in the process where necessary. Studies that satisfied the inclusion criteria were retrieved for full-text assessment. Full-text screening was performed in full independent double screening by the two authors. Only full-text records selected for inclusion by both the authors were included in this study. Any disagreements during this stage were resolved through discussion and consensus between the two authors and if agreement was not met between authors, the disagreements were discussed with the third author. The authors were contacted, where appropriate, to clarify missing or inadequate information to determine study eligibility. The primary reasons for the exclusion of articles were documented at all stages of the study selection. The study selection was conducted by using Microsoft Excel. A final list of articles was prepared and stored in Mendeley and Microsoft Excel for data extraction.
Data collection/extraction
Eligible studies were independently reviewed, and relevant data were extracted. The information that was gathered included authors, publication year, study region, study design, total number of participants recruited, study intervention or type of IF being implemented, IF duration or duration of the study and the readings or results of targeted primary outcomes and second outcomes. Data from each study was entered into a table in Microsoft Excel to ease the comparison process between the included studies. Numerical data were also extracted and expressed as mean ± standard deviation, or mean (SEM), and p-values, and the differences were considered statistically significant when p < 0.05.
Risk of bias in individual studies
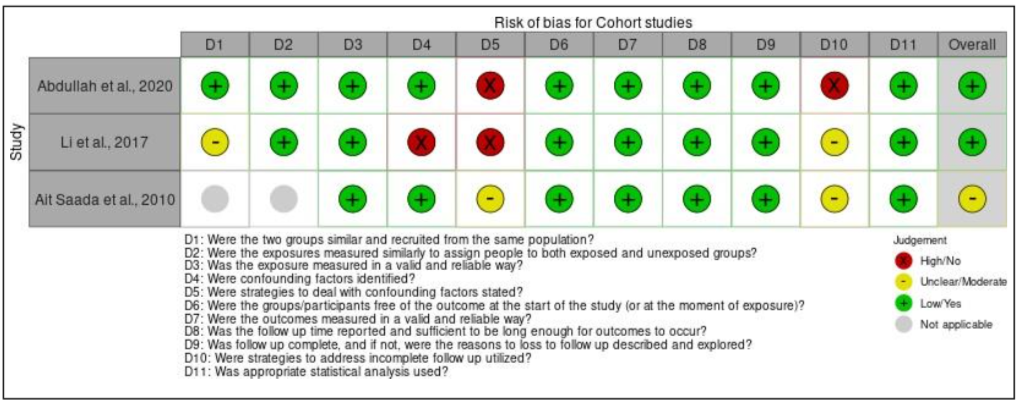
Two investigators independently assessed the risk of bias for all included studies by assessing their methodological quality using the Joanna Briggs Institute (JBI) critical appraisal checklists. Score of ‘1’ were given if the studies fulfil the stated criteria of the checklist and ‘0’ if not. After that, the total score was calculated and converted into percentage. Studies with percentage of <50% were considered as having low risk of bias, moderate risk, and high risk of bias if the percentage were between 50% – 69% and ≥70%, respectively [18]. Any disagreements will be resolved through discussion between the two investigators and later with the third investigator if an agreement was not met between the initial two investigators. The results of risk of bias for each type of studies included were then visualized as traffic-light plots by using Risk-of-bias VISualization (robvis) tool [19].
Results
Study selection
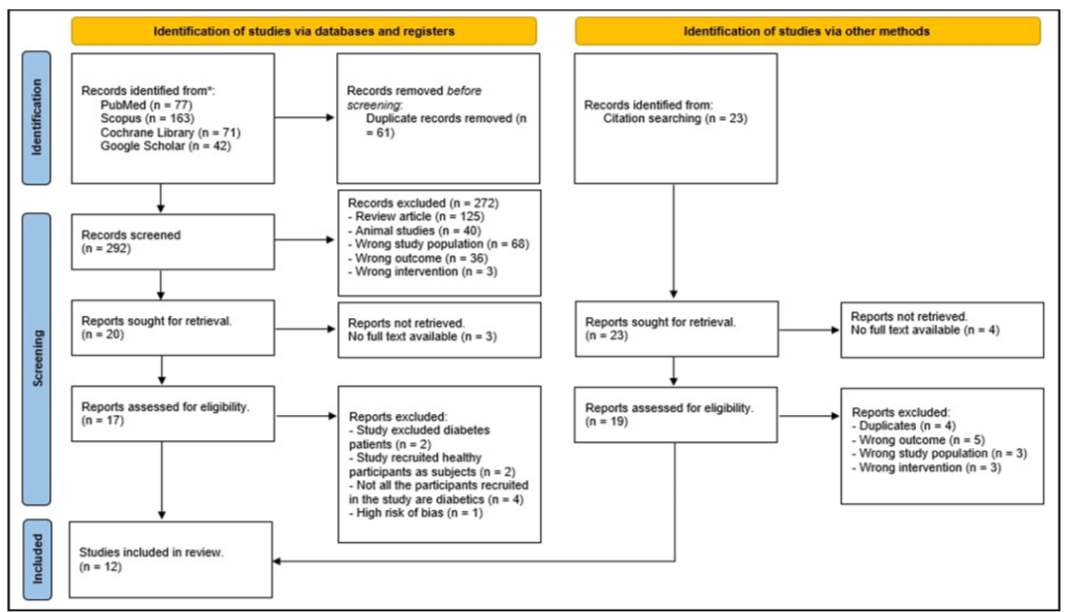
A total of 353 studies were identified within the databases used. Additional 23 studies were discovered by using snowball technique, by searching related studies within the references of the studies identified earlier in the databases. PubMed located 77 studies, Scopus located 163 studies, Cochrane Library located 71 studies and Google Scholar located 42 studies, which provided a total of 376 studies. From the databases, 61 studies were excluded due to being duplicates. After title and abstract screening have been done, 272 studies were excluded because they were review articles (n = 125), animal studies (n = 40), recruited wrong study samples (n = 68), did not have the targeted primary and secondary outcomes (n = 36) and used interventions other than IF (n = 3). From the remaining 20 articles, three articles were excluded as the full-text articles were not accessible and eight articles were excluded during full-text reading, with the following reasons: study excluded T2DM patients (n = 2), recruited healthy participants as study subjects (n = 2), has high risk of bias (n = 1) and not all participants recruited in the study have prediabetes or T2DM (n = 4).
After full-text screening, eight studies left from the databases and were included in the review. For the studies identified by using snowball technique, four studies were removed as there was no access to the full-text articles. From the remaining studies, four studies were excluded due to being duplicates, five studies did not report the outcomes of interest, three studies recruited participants that are not diagnosed with prediabetes or T2DM and three other studies used interventions other than IF, leaving four studies behind to be included in this study. As a result, this search produced a total of 12 studies that met the inclusion criteria and were deemed eligible to be included within this systematic review, with 8 of them obtained from the databases and 4 studies from the snowball technique. A PRISMA flow diagram for all database results and article selection can be found in Figure I. prediabetes or T2DM (n = 4). After full-text screening, eight studies left from the databases and were included in the review. For the studies identified by using snowball technique, four studies were removed as there were no access to the full-text articles, leaving 19 studies. From the remaining studies, four studies were excluded due to being duplicates, five studies did not report the outcomes of interest, three studies recruited participants that are not diagnosed with prediabetes or T2DM and 3 other studies used interventions other than IF, leaving 4 studies behind to be included in this study. As a result, this search produced a total of 12 studies that met the inclusion criteria and were deemed eligible to be included within this systematic review, with eight of them obtained from the databases and four studies from the snowball technique. A PRISMA flow diagram for all database results and article selection can be seen in Figure I.
Study characteristics
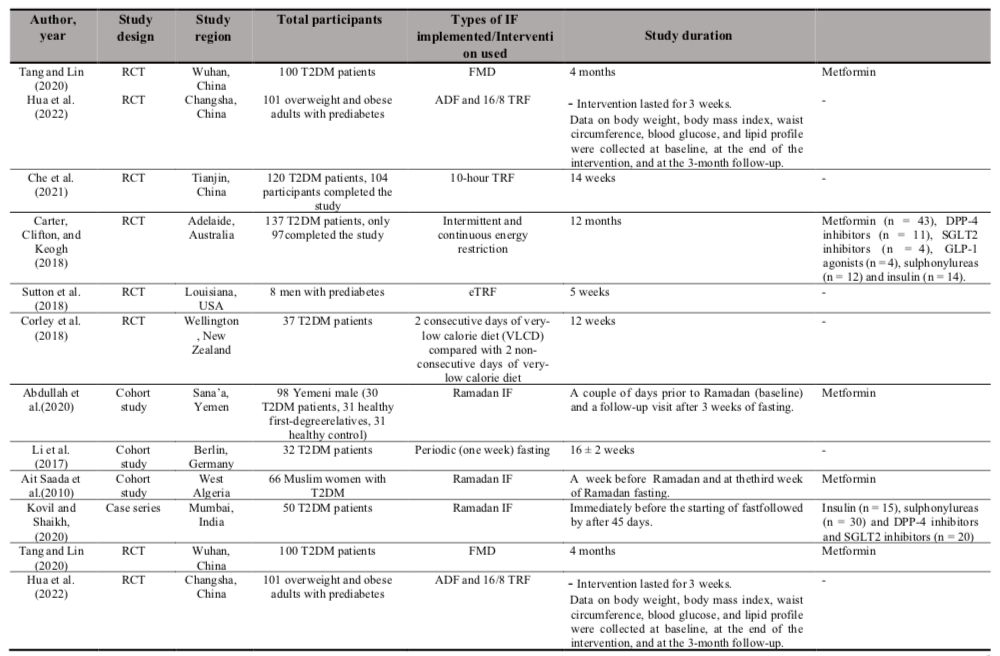
All included studies were published between the year 2010 to 2022 and comprise of four study designs which were RCT (n = 6), cohort studies (n = 3), case series (n = 2) and a quasi-experimental study. Three of the studies were conducted in China, two in Australia and one each in the United States of America, Canada, New Zealand, Yemen, Germany, Algeria, and India. The studies used certain types of IF with Ramadan IF were the most intervention used among the studies (n = 3). The other types of IF being implemented include 10-hour TRF (n = 1), fasting-mimicking diet (FMD) (n = 1), early-time restricted feeding (eTRF) (n = 1), 18-20 hour IF (n = 1), intermittent energy restriction for two days (n = 1), two consecutive days of very low calorie diet (n = 1), periodic fasting (n = 1), 16/8 TRF (n =1) and one study comparing between ADF and 16/8 TRF. Two of the studies recruited prediabetes participants as the subjects while the other ten studies recruited T2DM patients.
In addition, most studies included both genders except for the study by Sutton et al. (2018) and Abdullah, Al-Habori, and Al-Eryani, (2020) where they recruited only male participants and the study by (Ait Saada et al., 2010) where they recruited female participants only [20][21][22]. Moreover, seven of the studies included participants who were on OHA as stated in Table II below.
Risk of bias within studies
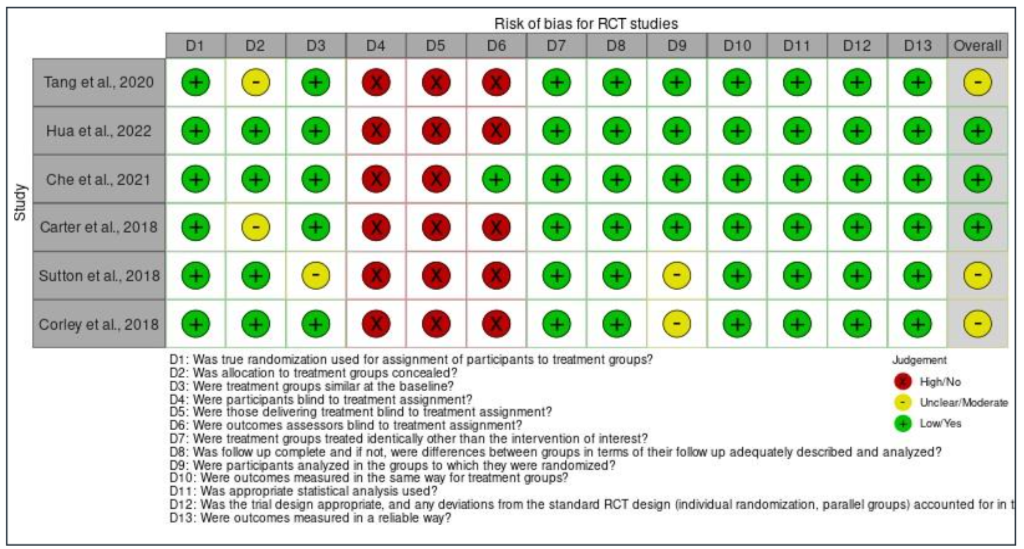
From all of the 12 studies included in the review, some articles demonstrated low risk of bias (showing high percentage of positive answers to the questions of JBI tool) [21][22][23][24][25][26][30] and six articles [22, 20, 27][28][29] had moderate risk of bias. For all the RCT studies, there were high risk of bias for domain four, five and six (except for the study conducted by Che et al. (2021), where they mentioned that outcome assessors were blinded to treatment assignment) all the participants, and those delivering treatment and the outcomes assessors from the studies were not blinded to treatment assignment [30]. One of the articles [30] mentioned that it was not possible to mask the intervention to those delivering intervention as they will need to explain to the participants how to practice the type of IF being assigned to them. According to the same study, it is also impossible to blind or mask the intervention from the participants because they need to know which group they are assigned, as they will need to adhere to the meal timing for any types of IFs being assigned to them.
For the cohort studies (Table II), there was overall high risk of bias for domain five, which is the strategies used to deal with confounding factors. This is because none of the studies mentioned in their report on how they dealt with the confounding factors. In addition, there was also overall high risk of bias for domain ten which examined the utilization of strategies to address incomplete follow-up. Same as domain five, none of the articles of the cohort studies reported this item. This is because, all the studies stated that they have successfully completed the follow-up. The study conducted by [21] and [22] reported that they completed the follow up in the third week of Ramadan fasting while the study by Li et al. (2017) completed the follow-up 16 weeks after starting the intervention [25].
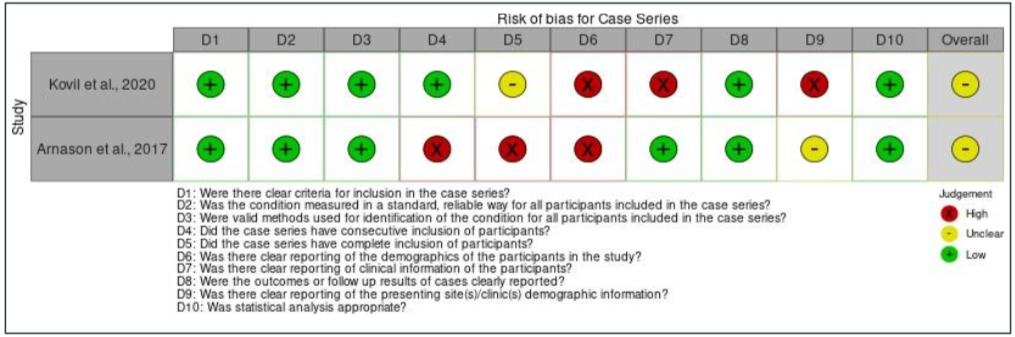
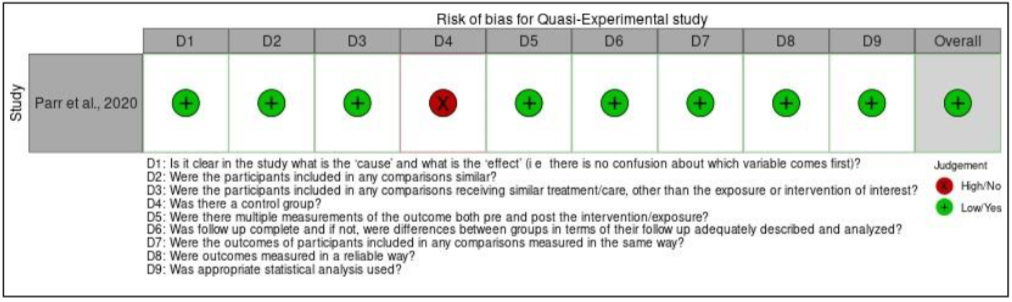
Moving on to case series, an overall high risk of bias for domain four (except the study by Kovil and Shaikh, 2020), five, six, and nine were found for all the studies. For domain four, the overall risk of bias was high because the study by Arnason et al. (2017) did not have consecutive inclusion of participants [10]. This is because the study did not mention the range of time when the participants were recruited as needed by the JBI critical appraisal checklist tool. For domain five, the overall risk of bias was also high as none of the studies reported that they included all the patients with prediabetes or T2DM presented at their clinic or available within the used patients’ databases. Furthermore, domain six also had overall high risk of bias because all the articles did not report the demographics of participants in their studies such as their age, sex, education, geographic region, and ethnicity. Next, the overall risk of bias for domain nine was also high as the studies did not explain in depth regarding the study population. The first and second domain were not applicable for the article by Ait Saada et al. (2010) as the study did not have a control group [22]. Finally, the quasi-experimental study has an overall low risk of bias, except for one domain which was domain four. This is because the study did not recruit any participants into a control group and monitor only the effect of TRE on 19 T2DM participants. The assessment of bias within studies is presented in Figure IIa until Figure IId.
Individual outcomes of the studies
The targeted primary outcomes for this review are cardiovascular markers such as SBP, DBP and lipid profiles which include TG, TC, LDL-c, and HDL-c. Meanwhile, the targeted secondary outcomes are BMI or body weight, waist circumference, and glycemic parameters such as HbA1c, FBG, glucose level, insulin level and insulin resistance measured as HOMA-IR. For the primary outcomes, all studies reported the effects of IF on the lipid profiles of the study subjects except for the study by Arnason et al. (2017) and Kovil and Shaikh (2020) [22][28]. From 10 studies reported the lipid profiles of the participants, 3 studies recorded significant improvement (p < 0.05) for all the lipid profiles which include TG, TC, LDL-c and HDL-c, after completed the intervention [22][29][31]. Che et al. (2021) in their study also reported significant reduction (p < 0.05) in all lipid profiles of the intervention group except for HDL-c, where the level was not significantly reduced after the intervention. On the other hand, the study conducted by Li et al. (2017) and Parr et al. (2020) found that there was not significant improvement (p > 0.05) in the lipid profiles of the participants in the IF group when compared to the control or baseline level [25][26]. However, the study by Sutton et al. (2018) recorded a significant increase in the level of TC (p = 0.02) and TG (p = 0.0007) at the end of intervention [20]. They explained that circulating TG might increase due to a longer fasting period (18 hours) prior testing and most likely reflects triglyceride re-esterification following lipolysis, as well as hepatic and intramuscular triglyceride storage. In addition, Carter et al. (2018) reported that HDL-c level of the participants reduced due to weight loss (p < 0.001) [23].
Furthermore, 7 out of 12 studies included recorded the effects of IF on SBP and DBP in the recruited participants at the end of interventions. From the seven studies, three studies (Li et al., 2017; Sutton et al., 2018; Tang and Lin, 2020) recorded significant reductions (p < 0.05) in both SBP and DBP readings after the intervention, three studies (Abdullah et al., 2020; Arnason et al., 2017; Corley et al., 2018) recorded reductions in both SBP and DBP but not statistically significant when compared to the baseline readings or control groups and one study (Kovil and Shaikh, 2020) recorded no changes happened for both SBP and DBP for the recruited participants with respect to the baseline readings. The targeted primary and secondary outcomes of the eligible studies included are described in detail in Table III [25][20][29][21][10][27][28].
Discussion
To the best of our knowledge, this is the first study that systematically review the effects of intermittent fasting on cardiovascular health of prediabetes and T2DM patients. In this study, the important findings are IF helps to reduce both SBP and DBP readings and improve the blood lipid profiles at the end of intervention, which are beneficial for the cardiovascular health for the prediabetes and T2DM patients. This is because prediabetes and T2DM patients have a 2-3 times higher risk of developing CVD as mentioned earlier. One of the possible mechanisms that IF benefits the cardiovascular health of the prediabetes and T2DM patients is by reducing the insulin resistance or blood glucose level. This hypothesis might be true as the pathogenesis of CVD in the prediabetes and T2DM patients revealed that insulin resistance and hyperinsulinemia play important roles in the process. Che et al. (2021) in their study recorded significant reduction in the HOMA-IR, HbA1c and FBG values improved significantly (p = 0.02, p < 0.001, p < 0.001, respectively) and thus all the lipid profiles (except HDL-c, p = 0.33) improved significantly (all p < 0.05) [30]. This is the same result reported by Ait Saada et al. (2010) and Carter et al. (2018) where they reported significant reduction in all lipid profiles (p < 0.05, p < 0.001, respectively) with significant reduction (p < 0.05) in the HbA1c readings [22][23].
Tang and Lin (2020) in their study also found that SBP, DBP and all lipid profiles improved significantly (all p < 0.05) with significant reduction in the HbA1c and FBG levels (both p < 0.05) [29]. Furthermore, Hua et al. (2022) recorded that all lipid profiles improved significantly (all p < 0.05) with significant reduction in the FBG readings (p < 0.05) [31]. On the other hand, Corley et al. (2018) reported that SBP, DBP and all lipid profiles (except for a clinically insignificant difference in LDL-c level) were not significantly improved (all p > 0.05) as the FBG and HbA1c readings were not significantly reduced (p > 0.05) [27]. Based on these results, the SBP, DBP and all the lipid profiles will improve with significant reduction in the blood glucose or insulin resistance. This fact can be supported from a cross-sectional study conducted by Wang et al. (2022) where 1747 T2DM patients were recruited, and study reported that the blood glucose levels were positively associated with TG (p < 0.01) and LDL (p < 0.01) levels and elevated TG/HDL-c (p < 0.01) and LDL-c/HDL-c (p < 0.01) ratios. They also reported that the TG levels were increased by 0.34 mmol/L with every 1 mmol/L increase in blood glucose levels.
However, the study by Sutton et al. (2018) found that the fasting TG and TC levels increased significantly (p = 0.0007, p = 0.02), even the insulin resistance and decreased significantly (p = 0.005) at the end of eTRF intervention [20]. This might
have happened due to long duration of fasting time (18 hours) prior testing and this most probably reflects triglyceride re- esterification following lipolysis occurring in hepatic and intramuscular triglyceride storage [33]. Nevertheless, they found that the SBP and DBP significantly reduced (both p = 0.03) at the end of intervention, probably due to reduction in the insulin resistance and insulin level. One other possibility is that eTRF enhances natriuresis by shifting salt intake relatively early in the day, when the circadian system increases sodium excretion [35]. Moreover, their study found that there was no significant reduction in FBG levels (p = 0.49) even though the fasting insulin levels and insulin sensitivity significantly improved (both p= 0.05). This is in line with several other studies that reported IF may be more effective improving the insulin sensitivity than reducing the blood glucose levels [36][37][38]. This is also proven with the study conducted by Ait Saada et al. (2010) where they reported that the FBG values were significantly increased (p < 0.05) even the HbA1c levels significantly reduced (p < 0.05) at the third week of Ramadan fasting [22]. They suggest that the increase in FBG levels might be contributed by increased gluconeogenesis at that time to compensate for the fall in the glycogenolysis.
Next, Li et al. (2017) in their studies found that periodic fasting causes reduction in the HOMA-IR, insulin and FBG levels but were not significant (p = 0.08, p = 0.42, p = 0.15, respectively), but the SBP and DBP significantly reduced (p = 0.04, p = 0.02, respectively) [25]. The lipid profiles on the other hand have not significantly improved. The results might be an indicator that even if the insulin resistance is not significantly reduced, it is enough to cause significant reduction in the blood pressure readings. Contrarily, the study conducted by Abdullah et al. (2020) found that the HOMA-IR increased significantly (p = 1.3 x 10⁻⁷) during the follow- up in the third week of Ramadan fasting, while the FBG did not significantly reduce (p = 0.651) [21]. As a result, they reported that the DBP increased slightly and the SBP and all lipid profiles were improved, but not statistically significant (all p > 0.05). They stated that the HOMA-IR was increased significantly due sleep deprivation during Ramadan fasting as it leads to elevation of proinflammatory cytokines like IL-6 and is a stressor leading to hypercortisolism. In addition, they mentioned that the leptin concentration was also increased during Ramadan fasting as the feeding patterns were shifted to nighttime where total calorie intake was higher at night, resulting in increased leptin concentration after meal at night. Consequently, both sleep disturbance and changes in feeding pattern during Ramadan fasting lead to decreased adiponectin concentration and thus promote insulin resistance [8]. This fact can be supported by a study conducted by Spiegel et al. (2005) which stated that recurrent sleep loss or short sleep led to an increased risk of developing insulin resistance as sleep has significant modulatory effects on glucose metabolism [39].
From this study, it is not possible to determine which type of IF is the best or most beneficial for the cardiovascular health of prediabetes and T2DM patients as the study included were only investigating a type of IF for their study and with different study periods. However, there are studies included comparing the effects between ADF and 16/8 TRF [24], intermittent and continuous energy restriction [23] and 2 consecutive days of very-low calorie diet (VLCD) compared with 2 non-consecutive days of very-low calorie diet [27]. The study conducted by Hua et al. (2022) found that there were no significant differences in FBG and LDL-c reduction between ADF and 16/8 TRF at the end of intervention. Moreover, ADF showed more significant improvement in HDL-c levels compared to the 16/8 TRF. On the other hand, 16/8 TRF was better in reducing the triglyceride level when compared to the ADF. Next, the study conducted by Carter et al. (2018) found that there were no significant differences between continuous and intermittent energy restriction in terms of HbA1c and FBG reduction, and improvement in all of the lipid profiles [23]. Moreover, Corley et al. (2018) reported that there were no significant differences between two consecutive and non-consecutive days of VLCD in HbA1c, FBG, HDL-c, and TG level while significant differences between the two interventions were seen for TC and LDL-c level at the end of the study [27]. However, since there are a limited number of studies comparing different types of IF, it is difficult to compare these results with other studies.
In this systematic review also, the included studies did not investigate whether the duration of study plays an important role for determining the benefits for cardiovascular health for both prediabetes and T2DM patients. Nonetheless, there is an interesting finding by Sutton et al. (2018) from their study where they found that 5 weeks of eTRF reduced the blood pressure significantly, as effective as antihypertensive medications such as angiotensin-converting enzyme (ACE) inhibitors [20]. However, we believe that a continuous intermittent fasting scheme should be practiced or followed to achieve more pronounced and significant effects for the cardiovascular health of prediabetes and T2DM patients. This fact can be proven by the study conducted by Arnason, Bowen, and Mansell (2017) where they found that the beneficial effects of intermittent fasting such as reduction in the blood pressure readings were not sustained after the IF was completed. These readings inflected back towards the baseline values once participants resumed to the normal diet [10]. This might be due to long periods of fasting that induce a strong physiological stimulus and pronounced hormonal changes such as stimulation of the hypothalamus-pituitary (HPA) axis, which translated into a hermetic stress reaction [25]. It is also important to consider the usage of OHA in the studies included as 8 of the included studies recruited participants who were on OHA. This is because certain groups of OHA which include biguanide (metformin), SGLT2-I, and GLP1-RA, have cardiovascular benefits for the T2DM patients (Clinical Practice Guideline, Management of T2DM, 2020). Thus, this factor must be taken into consideration to rule out the possibility of OHA effects instead of the IF itself.
In the CPG Management of T2DM (2020), it is stated that one of the recommended non- pharmacological interventions in preventing and managing prediabetes and T2DM is by reducing the calorie intake. IF fasting is one of the common approaches that is being practiced reducing the calorie intake [40]. However, it is also stated in that CPG that the effectiveness of IF in diabetes management is uncertain and not significantly different from conventional calorie-restricted diets due to limited evidence and small-scale studies. Nevertheless, based on the findings in this study, it is proven that IF can improve the cardiovascular health of prediabetes and T2DM patients as it can significantly lower the blood pressure and improve the lipid profiles at the end of intervention with respect to the baseline readings or control groups.
However, this study possesses some possible limitations. Firstly, this study included cohort studies, case series and a quasi-experimental study which recruited a relatively small number of participants. Next, there was only 3 included studies [23][24][27] that compared between 2 different types of IF. Thus, there is insufficient data to determine which type of IF is the most beneficial for cardiovascular health of the prediabetes and T2DM patients. In addition, this study also included only 2 studies [20][24] that recruited prediabetes participants as their study subjects. Hence, studies that recruited larger sample sizes
of prediabetes participants are needed to confirm the benefits of IF on their cardiovascular health. Based on all the studies included most of them reported cardiovascular benefits of IF as their secondary outcomes except for the studies conducted by Ait Saada et al. (2010), Arnason et al. (2017) and Kovil and Shaikh (2020) [22][10][28]. However, these 3 studies were only observational. Thus, RCTs investigating the effect of intermittent fasting on cardiovascular health of prediabetes and T2DM patients which makes the cardiovascular health as the primary outcome are warranted to confirm the benefits stated and discussed in this study. Once the benefits are confirmed based on the studies conducted, IF can be integrated into practice as one of the non-pharmacological interventions in preventing and managing prediabetes, T2DM and their associated complications. Besides, IF can be practiced by both patients that had already received their pharmacological treatment or not as part of disease management. In addition, future research can be done to compare the benefits of different types of IF for cardiovascular health and which type is the most practical and suitable to be practiced by prediabetes and T2DM patients. This is because there were only 3 studies included [23][24][27] in this systematic review that compared different types of IF.
Conclusion
Based on all the data obtained from the studies, most of the study reported that IF such as TRF, ADF and eTRF improved the blood pressure readings and lipid levels for the participants intervened with the IF regimen as compared to the baseline levels/readings or the control group. These cardiovascular benefits might be achieved due to reduction in the insulin resistance and the blood glucose level at the end of IF intervention. By improving the blood pressure readings and lipid profiles of prediabetes and T2DM patients, the risk of developing cardiovascular diseases such as hypertension and ischemic heart disease in the future can be reduced for prediabetes and T2DM patients. IF has a high potential to be used as one of the non-pharmacological interventions in managing and preventing prediabetes and T2DM and their associated complications. This systematic review reported only the effects of IF on cardiovascular health as the secondary outcomes after glycemic control, weight, BMI, and waist circumference, thus RCTs that focus on the benefits of IF on cardiovascular health of prediabetes and T2DM patients as their primary outcomes are warranted to confirm the findings in this study.
Conflict of Interest
The authors do not have any financial interests or commercial associations to disclose. All authors have viewed and agreed to the submission of this article.
Acknowledgement
Not available.
| Author (year) | Targeted primary outcomes | Targeted secondary outcomes |
| Tang and Lin (2020) | SBP: Decreased 14.18 ± 0.71 mmHg and 6.14 ± 0.71 mmHg for the IF and control groups, respectively, with p < 0.05, at the end of intervention.DBP: Decreased 10.98 ± 0.84 mmHg and 5.42 ± 0.55 mmHg for the for the IF and control groups, respectively, with p < 0.05, after 4 months.TC: Decreased 2.78 ± 0.09 mmol/L in IF group and 0.58 ± 0.02 mmol/L in control group.TG: Decreased 1.75 ± 0.06 mmol/L in IF group and 0.42 ± 0.06 mmol/L in control group.HDL-c: Increased 1.05 ± 0.1 mmol/L in IF group and 0.21 ± 0.02 mmol/L in control group.LDL-c: Decreased 1.96 ± 0.24 mmol/L in IF group and 0.58 ± 0.04 mmol/L in control group.All lipid profiles showing significant statistical intergroup differences (all p < 0.05) | HbA1c: Decreased by 1.36 % in the IF group and by 0.43% in the control group.FPG: Decreased 2.31 ± 0.33 mmol/L in IF group and 1.3 ± 0.15 mmol/L in control group.All glycemic parameters showed significant statistical intergroup differences (p < 0.05)BMI: Decreased 5.11 ± 0.18 kg/m2, and 1.13 ± 0.1 kg/m2 for the IF and control groups, respectively.Waist circumference: Decreased 14.28 ± 0.94cm and 5.94 ± 0.57 cm for the IF and control groups, respectively.Both BMI and waist circumference showing significant statistical intergroup differences (all p < 0.05). |
| Hua et al. (2022) | TC: ADF group showed more significant reduction in TC at the end of intervention than the control (p = 0.032) and 16/8 TRF group (p = 0.029)TG: 16/8 TRF showed significant reduction of TG compared to the control group at the end of intervention (p = 0.015) and at 3 months follow-up (p < 0.001). In contrast, ADF showed significant increase in TG compared to the 16/8 TRF compared to the control group at the end of intervention (p = 0.032) and at 3 months follow-up (p < 0.041).HDL-c: ADF group showed more significant improvement in HDL- c in all periods (all p < 0.05) while 16/8 TRF only showed significant improvement at 3 months follow-up (p = 0.004)LDL-c: 16/8 TRF group recorded a significant decrease in LDL-c at 3 months follow-up (p = 0.04) while no significant differences in LDL-c reduction between ADF and 16/8 TRF. | FBG: ADF group showed significant reduction in FBG at the end of intervention (p = 0.027) and at 3 months follow-up (p = 0.02) while 16/8 TRF group only showed significant reduction at 3 months follow-up (p < 0.001). No significant differences in FBG reduction between the two intervention groups.BMI: Both intervention groups showed significant reduction compared to the control group (all p < 0.01) across the study period. ADF group showed more significant reduction compared to the 16/8 TRF group both at the end of intervention and at 3 months follow-up (all p < 0.01)Waist circumference: Both intervention groups showed significant reduction compared to the control group (all p < 0.01) across the study period. TRF group showed significant reduction at the end of intervention (p < 0.001) a and at 3 months follow-up (p < 0.001) compared to baseline readings. |
| Author (year) | Targeted primary outcomes | Targeted secondary outcomes |
| Che et al. (2021) | TG: TRF group resulted in significant reduction of TG compared to the control group (− 0.23 ± 0.08 mmol/L, [9%] vs. 0.13 ± 0.06 mmol/L, [5%]; p = 0.03) over 12 weeks.TC: TRF group resulted in significant reduction of TC compared to the control group (− 0.32 ± 0.07 mmol/L [6%] vs. − 0.15 ± 0.06 mmol/L [3%], p = 0.01) over 12 weeks. LDL-c: TRF group resulted in significant reduction of TC compared to the control group (− 0.42 ± 0.13 mmol/L [11%] vs. − 0.21 ± 0.13 mmol/L [6%], p = 0.02) over 12 weeks. HDL-c: TRF group did not show any significant differences in HDL-c level compared to control group (− 0.16 ± 0.04 mmol/L vs. − 0.15 ± 0.05 mmol/L, p = 0.33) over 12 weeks. | HbAIc: TRF group showed significant decrease (− 1.54% ± 0.19) compared to control group (p < 0.001) over 12 weeks.FBG: Decreased significantly in TRF group compared to control group (− 1.47 ± 0.25 mmol/L [15%] vs. − 0.78 ± 0.21 mmol/L [8%], p < 0.001) over 12 weeks.HOMA-IR: Decreased significantly in TRF group compared to control group (− 0.51 ± 0.08 [14%] vs. − 0.12 ± 0.06 [3%], p = 0.02) over 12 weeks.BMI: TRF group showed significant decrease compared to control group (− 1.64 ± 0.38 kg/m2 [6%] vs. 0.42 ± 0.24 kg/m2 [2%], p < 0.001) over 12 weeks. |
| Carter, Clifton, and Keogh, (2018) | TG: The mean (SEM) TG level was reduced by 0.4144 (0.22) mmol/L with weight loss (p < 0.001), with no differences between groups.TC: The mean (SEM) TC level was reduced by 0.3367 (0.10) mmol/L with weight loss (p < 0.001), with no differences between groups.LDL-c: The mean (SEM) LDL-c level was reduced by 0.288 (0.085) mmol/L with weight loss (p < 0.001), with no differences between groups.HDL-c: The mean (SEM) HDL-c level was reduced by 0.0363 (0.039) mmol/L with weight loss (p < 0.001), with no differences between groups. | HbA1c: The mean (SEM) HbA1c level was reduced significantly, with no difference between treatment groups (–0.5% [0.2%] in the continuous energy restriction group vs –0.3% [0.1%] in the intermittent energy restriction group; P = 0.65).Body weight: Weight reduction was significant over time but not by treatment (–5.0 [0.8] kg in the continuous energy restriction group vs –6.8 [0.8] kg in the intermittent energy restriction group; P = 0.25). |
| Author (year) | Targeted primary outcomes | Targeted secondary outcomes |
| Sutton et al. (2018) | LDL-c: eTRF did not affect LDL-c level after 5 weeks of intervention (Δ = 2 ± 6 mg/dL; p = 0.75).HDL-c: eTRF did not affect HDL-c level after 5 weeks of intervention (Δ = −0.6 ± 0.9 mg/dL; p = 0.48).TG: eTRF group have a significant increase (p = 0.0007) in the level of TG by 57 ± 13 mg/dL after 5 weeks of intervention.TC: eTRF group have significant increase (p = 0.02) in the level of TC by 13 ± 5 mg/dL after 5 weeks of intervention.SBP: Morning levels of SBP reduced by 11 ± 4 mm Hg (p = 0.03) in eTRF group compared to the control group after 5 weeks of intervention.DBP: Morning levels of SBP reduced by 10 ± 4 mm Hg (p = 0.03) in eTRF group compared to the control group after 5 weeks of intervention. | FBG: 5 weeks eTRF did not show significant reduction in FBG (Δ = −2 ± 2 mg/dL; p = 0.49)Fasting insulin: 5 weeks eTRF decreased fasting insulin by 3.4 ± 1.6 mU/L (p = 0.05).Insulinogenic index (a marker of β cell responsiveness): 5 weeks of eTRF increased the insulinogenic index by 14 ± 7 U/mg (p = 0.05).Insulin resistance: Decreased by 36 ± 10 U/mg (p = 0.005), by measured by the 3-hr incremental area under the curve (AUC) ratio. |
| Corley et al. (2018) | SBP: There was reduction in SBP readings from baseline in both non-consecutive (133 ± 15 mmHg vs. 129 ± 12 mmHg) and consecutive VLCD groups (132 ± 12 mmHg vs. 129 ± 16 mmHg) at 12 weeks of intervention, but there are no significant statistical intergroup differences (p = 0.77).DBP: There was reduction in DBP readings from baseline in both non-consecutive (78 ± 11 mmHg vs.75 ± 10 mmHg) and consecutive VLCD groups (74 ± 11 mmHg vs. 72 ± 10 mmHg) at 12 weeks of intervention, but there are no significant statistical intergroup differences (p = 0.80).TC: There was reduction in TC levels from baseline in the non- consecutive (4.2 ± 1.0 mmol/L vs. 3.8 ± 0.8 mmol/L) but slightly increased in the consecutive VLCD groups (3.9 ± 0.8 mmol/L vs. 4.0 ± 1.0 mmol/L) at 12 weeks of intervention. TC showing significant statistical intergroup differences (p = 0.01). HDL-c: There was no effect on HDL-c levels from baseline in the non-consecutive (1.1 ± 0.2 mmol/L vs. 1.1 ± 0.2 mmol/L) but slightly increased in the consecutive VLCD groups (1. ± 0.2 mmol/L vs. 1.1 ± 0.2 mmol/L) at 12 weeks of intervention. HDL-c shows no significant statistical intergroup differences (p = 0.37).LDL-c: There was reduction in LDL-c levels from baseline in the non-consecutive (2.1 ± 0.8 mmol/L vs. 2.0 ± 0.7 mmol/L) but slightly increased in the consecutive VLCD groups (2.1 ± 0.8 mmol/L vs. 2.25 ± 0.81 mmol/L) at 12 weeks of intervention. TC showing significant statistical intergroup differences (p = 0.03).TG: There was reduction in TG levels from baseline in both non- consecutive (1.8 ± 0.6 mmol/L vs.1.7 ± 0.4 mmol/L) and consecutive VLCD groups (1.8 ± 0.7 mmol/L vs. 1.7 ± 0.8 mmol/L) at 12 weeks of intervention, but there are no significant statistical intergroup differences (p = 0.80). | BMI: There was reduction in BMI from baseline in both non- consecutive (36.8 ± 5.2 kg/m2 vs. 36.0 ± 5.2 kg/m2) and consecutive VLCD groups (36.6 ± 5.3 kg/m2 vs. 36.1 ± 5.5 kg/m2) at 12 weeks of intervention, but there are no significant statistical intergroup differences (p = 0.96).Waist circumference: There was reduction in waist circumference from baseline in both non-consecutive (122.5 ± 13.6 cm vs. 119.1 ± 14.2 cm) and consecutive VLCD groups (120.4 ± 17.0 cm vs. 118.8 ± 16.6 cm) at 12 weeks of intervention, but there are no significant statistical intergroup differences (p = 0.99).HbA1c: There was reduction in HbA1c levels from baseline in both non-consecutive (8.2 ± 1.3% vs. 7.5 ± 1.5%) and consecutive VLCD groups (8.4 ± 1.8% vs. 7.8 ± 1.8%) at 12 weeks of intervention, but there are no significant statistical intergroup differences (p = 0.53).FBG: There was reduction in FBG readings from baseline in both non-consecutive (9.0 ± 2.1 mmol/L vs. 7.9 ± 1.7 mmol/L) and consecutive VLCD groups (8.2 ± 2.8 mmol/L vs. 6.9 ± 2.1 mmol/L) at 12 weeks of intervention, but there are no significant statistical intergroup differences (p = 0.21). |
| Author (year) | Targeted primary outcomes | Targeted secondary outcomes |
| Abdullah et al. (2020) | SBP: Decreased slightly at the follow up but not statistically significant (p = 0.811) with respect to baseline level prior to Ramadan fasting (124.30 ± 4.11 mmHg vs. 124.00 ± 6.16 mmHg).DBP: Increased slightly at the follow up but not statistically significant (p = 0.09) with respect to baseline level prior to Ramadan fasting (83.30 ± 2.49 mmHg vs. 84.30 ± 2.59 mmHg).TG: Decreased but not significant (p = 0.06) in T2DM group by 6% with respect to the baseline prior to Ramadan fasting (124.64 ± 50.75 mg/dL).TC: Decreased but not significant (p = 0.08) in T2DM group by 5.1% with respect to the baseline prior to Ramadan fasting (178.38 ± 29.57 mg/dL).LDL-c: Decreased slightly at the follow up but not statistically significant (p = 0.395) with respect to baseline level prior to Ramadan fasting (38.30 ± 9.55 mg/dL vs. 37.34 ± 7.11 mg/dL).HDL-c: Decreased slightly at the follow up but not statistically significant (p = 0.371) with respect to baseline level prior to Ramadan fasting (111.15 ± 28.12 mg/dL vs. 106.03 ± 30.15 mg/dL). | BMI: Decreased slightly at the follow up but not statistically significant (p = 0.293) with respect to baseline level prior to Ramadan fasting (25.55 ± 4.49 kg/m2 vs. 25.51 ± 4.38 kg/m2).Waist circumference: Significantly (p = 0.024) decreased in T2DM group with respect to the baseline prior to Ramadan fasting (99.83 ± 14.20 kg/m2 vs. 99.61 ± 14.27 kg/m2).FBG: Decreased at the follow up but not statistically significant (p = 0.651) with respect to baseline level prior to Ramadan fasting (7.63 ± 2.23 mmol/L vs. 7.47 ± 1.80 mmol/L).HbA1c: Decreased significantly (p = 1 x 10⁻⁶) in T2DM group with respect to the baseline prior to Ramadan fasting (8.26 ± 1.7% vs. 7.40 ± 1.49%).Insulin: Increased significantly (p = 1.4 x 10⁻⁹) in T2DM group with respect to the baseline prior to Ramadan fasting (226.95 ± 75.05 pmol/L vs. 263.90 ± 86.25 pmol/L).HOMA-IR: Increased significantly (p = 1.3 x 10⁻⁷) in T2DM group with respect to the baseline prior to Ramadan fasting (4.43 ± 1.55 vs. 5.11 ± 1.74). |
| Parr et al. (2020) | TC: Decreased after 4 weeks of TRE (4.5 ± 0.8 mmol/L) compared to the 2 weeks habitual period (4.6 ± 0.9 mmol/L), but not statistically significant (p = 0.16).HDL-c: Did not change after 4 weeks of TRE (1.1 ± 0.3 mmol/L) compared to the 2 weeks habitual period (1.1 ± 0.3 mmol/L) with p = 0.16.LDL-c: Decreased after 4 weeks of TRE (2.5 ± 0.8 mmol/L) compared to the 2 weeks habitual period (2.6 ± 0.9 mmol/L), but not statistically significant (p = 0.22).TG: Did not change after 4 weeks of TRE (1.8 ± 0.8 mmol/L) compared to the 2 weeks habitual period (1.8 ± 0.7 mmol/L) with p= 0.78. | HbA1c: Decreased but not significant (p = 0.053) after 4 weeks of TRE (7.4 ± 1.0%) compared to the 2 weeks habitual period (7.6 ± 1.1%).FBG: No differences were measured in FBG after 4 weeks of TRE compared to the 2 weeks habitual period (p = 0.29).Insulin: No differences were measured in insulin after 4 weeks of TRE compared to the 2 weeks habitual period (p = 0.09). |
| Author (year) | Targeted primary outcomes | Targeted secondary outcomes |
| Li et al. (2017) | SBP: Significantly reduced (p = 0.04) in fasting group after the intervention with respect to the baseline level, with the mean change of −13.9 ± 15.3 mmHg. There were significant statistical (p = 0.01) intergroup differences between the fasting and control groups (mean change = 0.4 ± 15.8 mmHg; p = 0.25).DBP: Significantly reduced (p = 0.02) in fasting group after the intervention with respect to the baseline level, with the mean change of −9.0 ± 12.3 mmHg. There were significant statistical (p = 0.003) intergroup differences between the fasting and control groups (mean change = 3.2 ± 11.9 mmHg; p = 0.17).TG: Reduced after the intervention with respect to the baseline level but not statistically significant (p = 0.2), with the mean change of −26.6 ± 88.5 mg/dL. There were no significant statistical (p = 0.5) intergroup differences between the fasting and control groups (mean change = −2.5 ± 81.9 mg/dL; p = 0.9). HDL-c: Increased after the intervention with respect to the baseline level but not statistically significant (p = 0.2), with the mean change of 6.5 ± 23.3 mg/dL. There were no significant statistical (p = 0.14) intergroup differences between the fasting and control groups (mean change = −2.3 ± 6.9 mg/dL; p = 0.2).LDL-c: Decreased after the intervention with respect to the baseline level but not statistically significant (p = 0.9), with the mean change of −2.6 ± 26.9 mg/dL. There were no significant statistical (p = 0.2) intergroup differences between the fasting and control groups (mean change = −7.8 ± 17.3 mg/dL; p = 0.41).TC: Decreased after the intervention with respect to the baseline level but not statistically significant (p = 0.5), with the mean change of 0.5 ± 27.1 mg/dL. There were no significant statistical (p = 0.14) intergroup differences between the fasting and control groups (mean change = −15.5 ± 27.4mg/dL; p = 0.84). | BMI: Reduced after the intervention with respect to the baseline level but not statistically significant (p = 0.16), with the mean change of 1.2 ± 1.7 kg/m2. There were significant statistical (p = 0.03) intergroup differences between the fasting and control groups (mean change = − − 0.6 ± 2.6 kg/m2; p = 0.08). Waist circumference: Significantly reduced (p = 0.001) in fasting group after the intervention with respect to the baseline level, with the mean change of −9.0 ± 12.3 cm. There were significant statistical (p = 0.001) intergroup differences between the fasting and control groups (mean change = − 0.3 ± 2.0 cm; p = 0.72).FBG: Reduced after the intervention with respect to the baseline level but not statistically significant (p = 0.15), with the mean change of −10.6 ± 30.4 mg/dL. There were significant statistical (p = 0.03) intergroup differences between the fasting and control groups (mean change = − 38.4 ± 46.0 md/dL; p = 0.02). Insulin: Reduced after the intervention with respect to the baseline level but not statistically significant (p = 0.42), with the mean change of −3.5 ± 9.3 μU/ml. There were no significant statistical (p = 0.09) intergroup differences between the fasting and control groups (mean change = −0.2 ± 5.4 μU/ml; p = 0.05).HOMA-IR: Reduced (p = 0.08) in fasting group after the intervention with respect to the baseline level, with the mean change of −1.5 ± 4.6. There were no differences (p = 1.0) between the fasting and control groups (mean change = −1.5 ± 2.1; p = 0.06). |
| Author (year) | Targeted primary outcomes | Targeted secondary outcomes |
| Ait Saada et al. (2010) | TC: Levels during the fasting period (1.836 ± 0.473 g/L) were significantly lower (p < 0.05) than the non-fasting period (2.101 ±0.473 g/L)TG: Levels during the fasting period (1.489 ± 0.213 g/L) were significantly lower (p < 0.05) than the non-fasting period (1.769 ± 0.304 g/L)LDL-c: Levels during the fasting period (0.906 ± 0.374 g/L) were significantly lower (p < 0.05) than the non-fasting period (1.219 ± 0.527 g/L)HDL-c: Levels during the fasting period (0.671 ± 0.285 g/L) were significantly higher (p < 0.05) than the non-fasting period (0.557 ± 0.165 g/L) | BMI: Reduced at the week of Ramadan (27.40 ± 03.55 kg/m2) compared to the baseline, a week before fasting (27.57 ± 03.08 kg/m2), but not statistically significant (p = 0.36).FBG: The average FBG levels recorded were significantly (p < 0.05) higher 1.98 ± 0.17 g/L during fasting when compared to the baseline level, a week before fasting (1.85 ± 0.20 g/L).HbA1c: Levels of HbA1c reduced slightly during the fasting period at p < 0.05, reduced from 9.52% to 8.74%.Insulin: The average level of plasma insulin in the participants during fasting (11.97 ± 2.48 µU/ml) were significantly reduced (p < 0.05) from the baseline levels (14.62 ± 2.79 µU/ml). |
| Kovil and Shaikh, (2020) | SBP and DBP of the participants did not change during the Ramadan fasting (121/80 mmHg) when compared with the baseline value (121/80 mmHg). | BMI: Decreased significantly (p < 0.001) in the patients during follow up session (27.45 ± 5.06 kg/m2) when compared to baseline value (27.90 ± 5.11 kg/m2).HbA1c: Slightly decreased but statistically significant (p < 0.05) in the patients during follow up session (7.62 ± 0.99 mmol/mol) when compared to baseline value (7.90 ± 1.24 mmol/mol). |
| Arnason, Bowen, and Mansell, (2017) | SBP: Decreased after 2 weeks of IF (127.0 ± 21.4 mmHg) compared to the baseline level (130.0 ± 17.8 mmHg), with the mean change of −3 mmHg, but not statistically significant (p = 0.83). However, the reading was increased by 1.5 mmHg (128.5 ± 14.3 mmHg; p = 1.0) after 2 weeks of ending the intervention when participants returned to normal diet intake.DBP: Decreased after 2 weeks of IF (79.8 ± 15.7 mmHg) compared to the baseline level (80.5 ± 13.2 mmHg), with the mean change of −0.72 mmHg, but not statistically significant (p = 1.0). However, the reading was increased by 1.9 mmHg (81.7 ± 12.2 mmHg; p = 0.76) after 2 weeks of ending the intervention when participants returned to normal diet intake. | BMI: Decreased significantly (p = 0.01) after 2 weeks of IF (36.4 ± 8.1 kg/m2) compared to the baseline level (36.9 ± 8.3 kg/m2), with the mean change of −0.52 kg/m2. However, the reading was increased by 0.1kg/m2 (36.5 ± 8.1 kg/m2; p = 1.0) after 2 weeks of ending the intervention when participants returned to normal diet intake.Waist circumference: Decreased after 2 weeks of IF (107.8 ± 11.1 cm) compared to the baseline level (109.6 ± 11.1 cm), with the mean change of −1.75 cm, but not statistically significant (p = 0.086). The reading did not change at the end of study, after 4 weeks of completing the intervention (p = 1.0).HOMA-IR: There were no differences in the HOMA-IR value for all phases of the study (all p = 1.0). |
References
- International Diabetes Federation. 2021. ‘IDF Diabetes Atlas 10th Edition’.
- Clinical Practice Guideline Management of Type 2 Diabetes Mellitus. 2020. ‘Ministry of Health Malaysia Academy of Medicine Malaysia Malaysia Endocrine & Metabolic Society Family Medicine Specialists Association of Malaysia Diabetes Malaysia Management of Type 2 Diabetes Mellitus’.
- Ganasegeran, Kurubaran, Chee Peng Hor, Mohd Fadzly Amar Jamil, Hong Chuan Loh, Juliana Mohd Noor, Norshahida Abdul Hamid, Purnima Devi Suppiah, Mohd Rizal Abdul Manaf, Alan Swee Hock Ch’ng, and Irene Looi. ‘A Systematic Review of the Economic Burden of Type 2 Diabetes in Malaysia’. International Journal of Environmental Research and Public Health 2020 17(16):1–23. http://dx.doi.org/10.3390/ijerph17165723
- Shantal, Alvarez, Coffey Ryan, and M. Algotar. Amit. ‘Prediabetes’. Treasure Island (FL): StatPearls Publishing; 2022.
- Luz, Clara. ‘Efficacy of High-Intensity Exercise in Women with Prediabetes: Randomized, Controlled Trial, With Six Months Followed’. 2022.
- Glovaci, Diana, Wenjun Fan, and Nathan D. Wong. 2019. ‘Epidemiology of Diabetes Mellitus and Cardiovascular Disease’. Current Cardiology Reports 2019 21:4 21(4):1–8. https://doi.org/10.1007/s11886-019-1107-y
- Newman, Jonathan D., Arthur Z. Schwartzbard, Howard S. Weintraub, Ira J. Goldberg, and Jeffrey S. Berger. 2017. ‘Primary Prevention of Cardiovascular Disease in Diabetes Mellitus’. Journal of the American College of Cardiology 70(7):883–93. https://doi.org/10.1016/j.jacc.2017.07.001
- Ferrier, Denise R. 2017. Lippincott Illustrated Reviews: Biochemistry. Vol. 53. https://ifeet.org/files/-Richard_A._Harvey,_Denise_R. _Ferrier-_Biochemistry.pdf
- Nowosad, Karolina, and Monika Sujka. ‘Effect of Various Types of Intermittent Fasting (IF) on Weight Loss and Improvement of Diabetic Parameters in Human’. Current Nutrition Reports. 2021: 10(2):146–54. http://dx.doi.org/10.1007/s13668-021-00353-5
- Arnason, Terra G., Matthew W. Bowen, and Kerry D. Mansell. ‘Effects of Intermittent Fasting on Health Markers in Those with Type 2 Diabetes: A Pilot Study’. World Journal of Diabetes. 2017c; 8(4):154. http://dx.doi.org/10.4239/wjd.v8.i4.154
- Anton, Stephen D., Keelin Moehl, William T. Donahoo, Krisztina Marosi, Stephanie A. Lee, Arch G. Mainous, Christiaan Leeuwenburgh, and Mark P. Mattson. 2018. ‘Flipping the Metabolic Switch: Understanding and Applying the Health Benefits of Fasting’. Obesity (Silver Spring, Md.) 26(2):254–68. https://doi.org/10.1002%2Foby.22065
- Hu, Dandan, Zhibo Xie, Yuqian Ye, Suhad Bahijri, and Minshan Chen. 2020. ‘The Beneficial Effects of Intermittent Fasting: An Update on Mechanism, and the Role of Circadian Rhythm and Gut Microbiota’. Hepatobiliary Surgery and Nutrition 9(5):597. https://doi.org/10.21037%2Fhbsn-20-317
- Abdellatif, Mahmoud, and Simon Sedej. 2020. ‘Cardiovascular Benefits of Intermittent Fasting SPOTTED BY THE SCIENTISTS OF TOMORROW’. Cardiovascular Research 116:36– 38. https://doi.org/10.1093/cvr/cvaa022
- Malinowski, Bartosz, Klaudia Zalewska, Anna Węsierska, Maya M. Sokołowska, Maciej Socha, Grzegorz Liczner, Katarzyna Pawlak-Osińska, and Michał Wiciński. 2019. ‘Intermittent Fasting in Cardiovascular Disorders—An Overview’. Nutrients 11(3). https://doi.org/10.3390/nu11030673
- Welton, Stephanie, Robert Minty, Teresa O’Driscoll, Hannah Willms, Denise Poirier, Sharen Madden, and Len Kelly. ‘Intermittent Fasting and Weight Loss: Systematic Review’. Canadian Family Physician. 2020; 66(2):117.
- Rahmani, Jamal, Hamed Kord Varkaneh, Cain Clark, Hamid Zand, Hiba Bawadi, Paul M. Ryand, Somaye Fatahi, and Yong Zhang. 2019. ‘The Influence of Fasting and Energy Restricting Diets on IGF-1 Levels in Humans: A Systematic Review and Meta-Analysis’. Ageing Research Reviews 53. https://doi.org/10.1016/j.arr.2019.100910
- Mattson, Mark P., Keelin Moehl, Nathaniel Ghena, Maggie Schmaedick, and Aiwu Cheng. ‘Intermittent Metabolic Switching, Neuroplasticity and Brain Health’. Nature Reviews. Neuroscience.2018; 19(2):81–94. https://doi.org/10.1038/nrn.2017.156
- Franco, Ademir, Maria Tereza Campos Vidigal, Murilo Navarro de Oliveira, Claudio Tarso de Jesus Santos Nascimento, Rhonan Ferreira da Silva, and Luiz Renato Paranhos. 2020. ‘Evidence-Based Mapping of Third Molar Techniques for Age Estimation Applied to Brazilian Adolescents – a Systematic Review’. Research, Society and Development 9(10): e9339109395.
- McGuinness, Luke A., and Julian P. T. Higgins. ‘Risk-of-Bias VISualization (Robvis): An R Package and Shiny Web App for Visualizing Risk-of-Bias Assessments’. Research Synthesis Methods, 2020, 12(1), 55–61. https://doi.org/10.1002/jrsm.1411
- Sutton, E. F., R. Beyl, K. S. Early, W. T. Cefalu, E. Ravussin, and C. M. Peterson. 2018. ‘Early Time-Restricted Feeding Improves Insulin Sensitivity, Blood Pressure, and Oxidative Stress Even without Weight Loss in Men with Prediabetes’. 27(6). https://doi.org/10.1016/j.cmet.2018.04.010
- Abdullah, K., M. Al-Habori, and E. Al-Eryani. 2020. ‘Ramadan Intermittent Fasting Affects Adipokines and Leptin/Adiponectin Ratio in Type 2 Diabetes Mellitus and Their FirstDegree Relatives’. BioMed Research International 2020. 1281792. https://doi.org/10.1155/2020/1281792
- Ait Saada, D., G. Selselet Attou, L. Belkacemi, O. Ait Chabane, M. Italhi, A. M. A. Bekada, and D. Kati. 2010. ‘Effect of Ramadan Fasting on Glucose, Glycosylated Haemoglobin, Insulin, Lipids and Proteinous Concentrations in Women with Non-Insulin Dependent Diabetes Mellitus’. African Journal of Biotechnology 9(1):087–094. https://www.ajol.info/index.php/ajb/article/view/77772
- Carter, Sharayah, Peter M. Clifton, and Jennifer B. Keogh. 2018. ‘Effect of Intermittent Compared with Continuous Energy Restricted Diet on Glycemic Control in Patients with Type 2 Diabetes: A Randomized Noninferiority Trial’. JAMA Network Open 1(3): e180756. https://doi.org/10.1001/jamanetworkopen.2018.0756
- Hua, C. A. I., C. A. O. Xi, Q. I. N. Yuelan, Ho Yu Cheng, and Michael Timothy Ng. 2022. ‘Intermittent Fasting in Weight Loss and Cardiometabolic Risk Reduction: A Randomized Controlled Trial’. Journal of Nursing Research 30(1):e185. https://doi.org/10.1097/jnr.0000000000000469
- Li, C., B. Sadraie, N. Steckhan, C. Kessler, R. Stange, M. Jeitler, and A. Michalsen. 2017. ‘Effects of A One-Week Fasting Therapy in Patients with Type-2 Diabetes Mellitus and Metabolic Syndrome – A Randomized Controlled Explorative Study’. (9). https://doi.org/10.1055/s-0043-101700
- Parr, E. B., B. L. Devlin, K. H. C. Lim, L. N. Z. Moresi, C. Geils, L. Brennan, and J. A. Hawley. 2020. ‘Time-Restricted Eating as a Nutrition Strategy for Individuals with Type 2 Diabetes: A Feasibility Study’. Nutrients 12(11). https://doi.org/10.3390/nu12113228
- Corley, B. T., R. W. Carroll, R. M. Hall, M. Weatherall, A. Parry-Strong, and J. D. Krebs. 2018. ‘Intermittent Fasting in Type 2 Diabetes Mellitus and the Risk of Hypoglycaemia: A Randomized Controlled Trial’. Diabetic Medicine 35(5):588–94. https://doi.org/10.1111/dme.13595
- Kovil, R., and N. Shaikh. 2020. ‘Study of Beneficial Impact on Specific Biomarkers in Type 2 Diabetes During Ramadan Fasting (Unintentional Intermittent Fasting)’. The Journal of the Association of Physicians of India 68(6):26–29. https://www.japi.org/v2c484a4/study-of-beneficial-impact-on-specific-biomarkers-in-type-2-diabetes-during-ramadan-fasting-unintentional-intermittent-fasting-
- Tang, Fang, and Xuan Lin. 2020. ‘Effects of Fasting-Mimicking Diet and Specific Meal Replacement Foods on Blood Glucose Control in Patients with Type 2 Diabetes: A Randomized Controlled Trial’. Oxid Med Cell Longev 2020:6615295. https://doi.org/10.1155/2020/6615295
- Che, T., C. Yan, D. Tian, X. Zhang, X. Liu, and Z. Wu. 2021. ‘Time-Restricted Feeding Improves Blood Glucose and Insulin Sensitivity in Overweight Patients with Type 2 Diabetes: A Randomised Controlled Trial’. Nutrition and Metabolism 18(1). https://doi.org/10.1186/s12986-021-00613-9
- Hua, C. A. I., C. A. O. Xi, Q. I. N. Yuelan, Ho Yu Cheng, and Michael Timothy Ng. 2022. ‘Intermittent Fasting in Weight Loss and Cardiometabolic Risk Reduction: A Randomized Controlled Trial’. Journal of Nursing Research 30(1):e185. https://doi.org/10.1097/jnr.0000000000000469
- Wang, Liqun, Ning Yan, Min Zhang, Ruiping Pan, Yuqi Dang, and Yang Niu. 2022. ‘The Association between Blood Glucose Levels and Lipids or Lipid Ratios in Type 2 Diabetes Patients: A Cross-Sectional Study’. Frontiers in Endocrinology 13:2206. https://doi.org/10.3389/fendo.2022.969080
- Soeters, Maarten R., Peter B. Soeters, Marieke G. Schooneman, Sander M. Houten, and Johannes A. Romijn. 2012. ‘Adaptive Reciprocity of Lipid and Glucose Metabolism in Human Short-Term Starvation’. American Journal of Physiology – Endocrinology and Metabolism 303(12):1397–1407. https://doi.org/10.1152/ajpendo.00397.2012
- Antoni, Rona, Kelly L. Johnston, Adam L. Collins, and M. Denise Robertson. 2016. ‘Investigation into the Acute Effects of Total and Partial Energy Restriction on Postprandial Metabolism among Overweight/Obese Participants’. The British Journal of Nutrition 115(6):951–59. https://doi.org/10.1017/s0007114515005346
- Antoni, Rona, Kelly L. Johnston, Adam L. Collins, and M. Denise Robertson. 2016. ‘Investigation into the Acute Effects of Total and Partial Energy Restriction on Postprandial Metabolism among Overweight/Obese Participants’. The British Journal of Nutrition 115(6):951–59. https://doi.org/10.1017/s0007114515005346
- Bhutani, Surabhi, Monica C. Klempel, Cynthia M. Kroeger, John F. Trepanowski, and Krista A. Varady. 2013. ‘Alternate Day Fasting and Endurance Exercise Combine to Reduce Body Weight and Favorably Alter Plasma Lipids in Obese Humans’. Obesity 21(7):1370–79. https://doi.org/10.1002/oby.20353
- Trepanowski, John F., Cynthia M. Kroeger, Adrienne Barnosky, Monica C. Klempel, Surabhi Bhutani, Kristin K. Hoddy, Kelsey Gabel, Sally Freels, Joseph Rigdon, Jennifer Rood, Eric Ravussin, and Krista A. Varady. 2017. ‘Effect of Alternate-Day Fasting on Weight Loss, Weight Maintenance, and Cardioprotection Among Metabolically Healthy Obese Adults: A Randomized Clinical Trial’. JAMA Internal Medicine 177(7):930–38. https://doi.org/10.1001/jamainternmed.2017.0936
- Wegman, Martin P., Michael H. Guo, Douglas M. Bennion, Meena N. Shankar, Stephen M. Chrzanowski, Leslie A. Goldberg, Jinze Xu, Tiffany A. Williams, Xiaomin Lu, Stephen I. Hsu, Stephen D. Anton, Christiaan Leeuwenburgh, and Mark L. Brantly. 2015. ‘Practicality of Intermittent Fasting in Humans and Its Effect on Oxidative Stress and Genes Related to Aging and Metabolism’. 2015 Apr;18(2):162-72.https://doi.org/10.1089/rej.2014.1624
- Spiegel, Karine, Kristen Knutson, Rachel Leproult, Esra Tasali, and Eve Van Cauter. 2005. ‘Sleep Loss: A Novel Risk Factor for Insulin Resistance and Type 2 Diabetes’. Journal of Applied Physiology (Bethesda, Md.: 1985) 99(5):2008–19. https://doi.org/10.1152/japplphysiol.00660.2005
- Anton, Stephen D., Keelin Moehl, William T. Donahoo, Krisztina Marosi, Stephanie A. Lee, Arch G. Mainous, Christiaan Leeuwenburgh, and Mark P. Mattson. 2018. ‘Flipping the Metabolic Switch: Understanding and Applying the Health Benefits of Fasting’. Obesity (Silver Spring, Md.) 26(2):254–68. https://doi.org/10.1002%2Foby.22065
- Joanna Briggs Institute (JBI) critical appraisal checklists https://jbi.global/sites/default/files/2019-05/JBI_Critical_Appraisal-Checklist_for_Systematic_Reviews2017_0.pdf
Please cite this article as:
Muhammad Naif Hafizin Afdzal Rasif, Amirah Farhana Nazri and May Khin Soe, The Effects of Intermittent Fasting on Cardiovascular Health of Prediabetes and Type 2 Diabetes Mellitus (T2DM) Patients: A Systematic Review. Malaysian Journal of Pharmacy (MJP). 2023;2(9):1-19. https://mjpharm.org/the-effects-of-intermittent-fasting-on-cardiovascular-health-of-prediabetes-and-type-2-diabetes-mellitus-t2dm-patients-a-systematic-review/