Abstract
Background: Acute kidney injury (AKI) is a common complication in hospitalized patients and is associated with a high mortality rate. A precise estimation of creatinine clearance (Clcr) is of great importance in daily clinical practice, particularly among critically ill patients with unstable kidney function, in guiding drug dosage adjustment. Clcr can be determined precisely through a simple laboratory method (amount of total urinary creatinine divided by the average of two consecutive serum creatinine concentrations) in patients with stable kidney function. However, in patients with rapidly improving kidney function, Clcr determined by the laboratory method can produce highly variable and inaccurate results due to the non-linear changes in plasma creatinine concentrations. Aim To determine the magnitude of discrepancies of Clcr calculated using the two-point average method to the actual Clcr and derive a correction factor for creatinine clearance determined by the two-point average method. Methods Patients with improving kidney functions were simulated. The actual urinary creatinine clearance, Ae 0-24, was subsequently calculated using area under the curve (AUC) 0-24 hours via Simpson’s approximation. Creatinine clearances were then calculated using Ae 0-24 / AUC0-24 and the 2-point average method. Results When Clcr improved greater than 35 ml/min, Clcr estimated by the 2-points method deviated significantly in progress from the actual Clcr whereby it underestimated the Clcr by 38%. The derived correction factor is 65 • [Clcr(ne)/ 33]. The correlation between actual Clcr and Clcr with correction factor was reported as R2 = 0.9882. Conclusion During the improvement kidney function, measuring urinary creatinine clearance using the 2-points average method can produce highly inaccurate Clcr measurement, particularly at Clcr ≥ 35 ml/min. The correction factor derived is found to be able to address the mentioned pitfall with low error.
Introduction
Acute kidney injury (AKI) is a common complication in hospitalized patients and is associated with a high mortality rate. The incidence of AKI is markedly higher in critically ill patients and those admitted to ICU settings. An estimated 5 to 20% of critically ill patients experience an episode of AKI during the course of their illness [1]. Critically ill patients normally have fluctuating renal function with serum creatinine changing from day to day [2] as well as dilution effects of parenteral solutions (in large quantities) on serum creatinine. Hence, the patient’s GFR estimation is of great importance in daily clinical practice, particularly among critically ill patients with unstable kidney function. Creatinine clearance (Clcr) has been the most widely used method to measure glomerular filtration rate and it requires the complete timed collection of urine as well as a blood sample of serum creatinine (taken during the urine collection period) [3]. An accurate estimation
of kidney function is vital for the routine care of patients which includes diagnosing of kidney disease, monitoring the progression kidney disease and drug dosages adjustment [4]. Inappropriate drug dosing in patients with unstable kidney function is an important cause of adverse drug events. Drug therapy may not be effective or may be toxic if there were inappropriate drugs dosing based on false creatinine clearance estimation, especially for drugs with narrow therapeutic indexes. Clcr can be determined accurately through a simple laboratory method (amount of total urinary creatinine divided by the average of two consecutive serum creatinine concentrations or known as the 2-point average method) in patients with stable kidney function[5]. The limitation of the urinary creatinine method is that it is only valid in patients with stable renal function. According to Chow and Schweizer (1985), the 24-hours urinary creatinine clearance method produced inaccurate and highly variable results in patients with rapidly improving renal function. The authors revealed that the commonly used the 2 points average method in estimating one’s Clcr during improving renal functions are prone to error. On the other hand, when renal function was deteriorating, the Clcr estimated by using the 2-points average method was found to have non-significantly deviated from the theoretical Clcr. There is a non-linear change in serum creatinine when renal function is improving based on one compartmental model. It is noted that the predicted Clcr in patients with rapidly improving renal function deviated significantly from the actual Clcr based on the known Clcr (Actual Clcr), Ae. The deviation was found significantly deviated when Clcr was greater than 40 ml/min. In the simulated model, when the actual (or theoretical) Clcr was 80 ml/min, the calculated Clcr based on 2 points (C0 and C24) average method was 54.7 ml/min, which translated to a -31.63% (underestimating) of deviation[6][7]. Therefore, the aims of this study were: (a) to determine the magnitude of discrepancies of Clcr calculated using the two-point average method to the actual Clcr in patients with rapidly improving kidney function; (b) to derive a correction factor for Clcr determined by the two-point average method in patients with rapidly improving kidney function and (c) to find the correlation of Clcr from improved method to the known Clcr.
Methodology
Data simulation
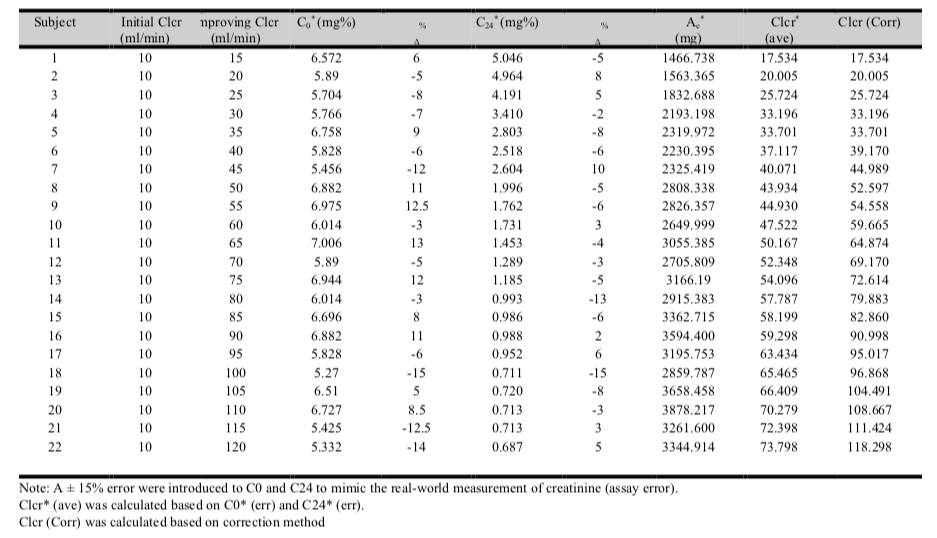
The study design involved the generation of the theoretical model for creatinine clearance in patients with rapidly improving kidney function, generation of equations for the model, and deriving a method for reference Clcr in patients with rapidly improving renal function. Serum creatinine at a specific point in time (C0, C12, and C24) was simulated with theoretical creatinine clearances (known Clcr) using equation 1. The serum creatinine was simulated for twenty-two 60 years old, 65 kg body weight and 170 cm height males (typical Asian body height and weight) with improving renal function. In each subject, an initial creatinine clearance of 10 ml/min and serum creatinine concentration, C1 of 6.2 mg% (mg/dL) were assumed. Improving creatinine clearance of 15, 20, 25, 30, 35, 40, 45, 50, 55, 60, 65, 70, 75, 80, 85, 90, 95, 100, 105, 110, 115 and 120 ml/min were assumed in subjects 1 to 22 respectively. Subsequently, an additional of twenty-two set of data was simulated using the similar method but an error of ±15% (randomly) was intentionally introduced to C0 and C24 to yield C0(err) and C24 (err).
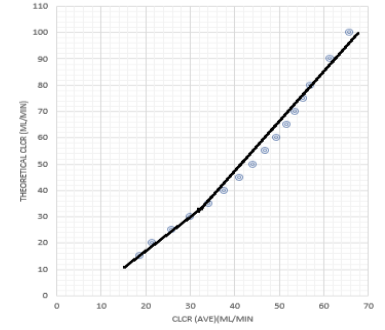
The actual urinary creatinine clearance, Ae 0-24, was subsequently calculated using area under the curve (AUC) 0-24 hours estimated via Simpson’s approximation (Appendix 1). Creatinine clearances were then calculated using Ae 0-24 / AUC0-24 and Ae 0-24 /AUC (2 points average). A straight line for data from 15 to 40ml/min and another straight-line form 30 ml above was plotted (figure 2), the 2 straight lines intersected at 35 ml/min. The simulated creatinine clearances using the 2-points average method 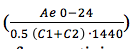 were then used to derive a correction factor for creatinine clearance with reference to the known Clcr or theoretical Clcr using simulated patients with Clcr of greater than 35 ml/min.
The 2 points average method is the method used in laboratory to measure the 24 hours creatinine clearance (using total creatinine excreted through urine divided by average serum creatinine at time t = 0 and t = 24). The derived correction factor was then tested on Clcr (2 points average method) estimated with C0 (err) and C24 (err). C0 (err) and C24 (err) were generated by intentionally introduced an error of ±15% to the known C0 and C24 to mimic the real-world scenario where there will be an assay errors within ±15% in laboratory[9]. An error between -15% to 15% (e.g. -12%, -5%, 6%, 13%) were randomly introduced to the generated C0 and C24. Corrected Clcr based on C0 (err) and C24(err) was then computed and labelled as Clcr* (corr). A graph on correlation between theoretical Clcr and Clcr* (corr) was plotted and R2 value was obtained. The correction factor was further validated in a larger simulated sample (200 samples) with various degrees of improving renal functions, various ages, body weighs and genders. This step was to confirm the application of Clcr* (corr) in predicting the theoretical Clcr (known Clcr). Root mean square error (RMSE) calculation was performed to evaluate the accuracy of the model.
Note: Known or actual Clcr refers to the real Clcr based on the proven model (Figure 1) while estimated Clcr refers to Clcr estimated by the 2-point average method.
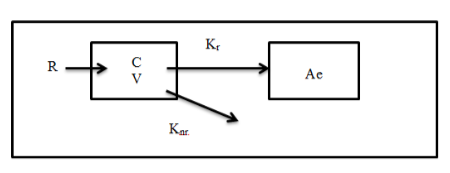
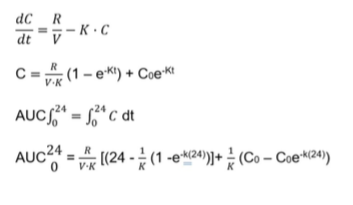
Where R = production rate; C = Serum creatinine concentration; V = volume of distribution, Kr = renal elimination rate constant;
Knr = nonrenal elimination rate constant; and Ae = urinary creatinine excretion.
R, Creatinine production rate = 28 – (0.2 x age) mg/kg/day; female, R is multiplied by 0.8.
V, Volume of distribution = 0.6 L/kg
Knr, Non-renal clearance = 2.86 x 10⁻² ml/min/kg
The endogenous creatinine production rate, R, within an individual is constant as long as muscle mass is constant[6]. The exceptions are patients assumed to be with liver disease and muscle atrophy. The volume of distribution for creatinine, V = 0.6 L/kg is also assumed to be constant in patient with unstable renal function[6]. An exceptional is the patients with ascites whereby the volume of distribution for creatinine would be greatly increased.
Based on the above-proposed model, the serum creatinine concentration, C at any time, t, can be derived by the following equations[7]:
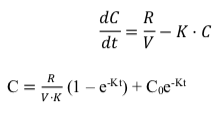
According to Hankins et al. (1981), a one-compartmental model is generally adequate to describe the creatinine kinetics in renally impaired patients of various ages, heights and body weights. The three parameters are chosen as creatinine generation and excretion are closely associated and influenced by the mentioned three parameters [8]. Chow (1985) has also described that a one-compartmental model is sufficient to describe creatinine kinetics in patients with unstable renal function. Equation 1 has been tested in three studies published in 1975, 1984 and 1985 respectively by Chiou and Hsu (1975) as well as Chow and Robert (1984 & 1985)[6][7][10].
Statistical
Root mean square error (RMSE) was used to determine the predictive performance of the simulated serum creatinine. RMSE is one of the ways to measure the accuracy of a predictive model. In general, the lower the RMSE value, the better the model’s predictive accuracy. A lower RMSE indicates that the model’s predicted values are closer to the actual values. Conversely, a higher RMSE suggests that the model’s predictions have larger average differences from the actual values. Pearson correlation analysis was used to analyze the R2 between actual Clcr and Clcr with correction factor applied. If the R value is between 0.00 to 0.25, there is little or no relationship, while 0.26 to 0.49 indicates low relationship, 0.50 to 0.69 indicates moderate relationship, 0.70 to 0.89 indicates high relationship, and 0.90 to 1.00 indicates very high relationship. Paired T test was used for pair-wise comparison. Paired T test is a statistical test used to determine if there is a significant difference between the means of two related or paired groups [11].
Results
Simulated data in patient with improving kidney function
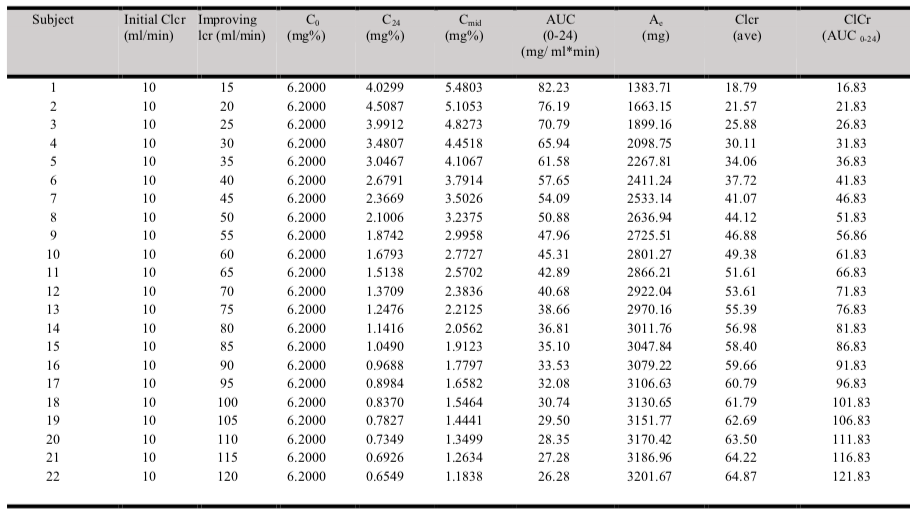
The results of the simulated serum creatinine data for twenty-two 60 years old, 65 kg body weight and 170 cm height males with various degree of improving renal functions are illustrated in Table 1.
The root mean square error (RMSE) of the model was 0.27. The data generated in table 4.1 revealed that the 2-points average method ((C0+C24)/2) that is normally applied was able to predict a Clcr that is closed to the theoretical (known) Clcr by using the known urinary creatinine clearance (Ae). However, it was only true when Clcr was less than 35 ml/min. When Clcr improved greater than 35 ml/min, Clcr estimated by the 2-points method deviated significantly in progress from the known Clcr. When known Clcr was 100 ml/min, the 2-points method yielded an eatimated Clcr of 62 ml/min. In other word, the 2-points estimation method underestimated the Clcr by 38% when renal function improved from 10 ml/min to 100 ml/min.
Derivation of correction factor
Derivation of the correction factor is performed based on figure 2. Figure 2 demonstrated a non-linear curve when Clcr is greater than 35 ml/min. Graph (figure 2) is plotted based on data generated in table 1, 100 ml/min theoretical Clcr matched with 68 ml/min Clcr by (C1, C2) ave method.
The magnitude of discrepancies or error between theoretical Clcr and Clcr predicted by (C1, C2) ave method are minimal or non-significant at Clcr lower than 35 ml/min. When Clcr = 50 ml/min (predicted by C1, C2 ave method), the true Clcr (based on theoretical Clcr) is 66 ml/min with a 32% of error noted. Hence, calculation based on Clcr (C1, C2) ave needs to be corrected.
Steps in deriving the correction factor:
Example: Assuming the Clcr ((C1,C2)) ̅ = 45 ml/min
Step 1: Determine the net error Clcr, Clcr(ne), for Clcr greater than 35 ml/min.
| Clcr(ne) | = 45 ml/min – 35 ml/min |
| = 10 ml/min |
Step 2: Determine the correction factor.
| Correction factor | = 100 – 35 (Y-axis); 68 – 35 (X-axis) = (100 – 35)* • [(Clcr(ne))/((68-35)*)] = 65 • 10/33 = 19.70 ml/min |
Step 3: Calculate the corrected Clcr (c) = Correction factor + 35 ml/min
| = 19.7 + 35 ml/min = 54.70 ml/min |
This indicates that after applying the correction factor the real Clcr shall be 54.70 ml/min instead of 45 ml/min. The 2 points average method underestimated the Clcr by 21.56%.
An error of ±15% (any % between -15% to 15%) was intentionally introduced (randomly) to C0 and C24 to yield C0(err) and C24 (err). Ae* was calculated based on AUC24 computed using C0 (err) and C24 (err). Clcr was estimated using the 2-points average method and correction method. Similar trends were observed for Clcr estimated by the 2-points method compared to theoretical Clcr (refer to table 1 and figure 2). Estimated Clcr by 2-points average method significantly underestimated the actual Clcr when actual Clcr > 35 ml/min. The correction method was noted to be able to predict Clcr closed (lowest prediction error) to the theoretical Clcr at all levels of improvements.
Between the two methods (2-points average and correction method), the Clcr estimated by the 2-points average method revealed the highest error using theoretical Clcr as a reference. A mean error of –25.48% was observed between Clcr estimated by the 2-points average method and theoretical Clcr. The observed difference was statistically significant, p < 0.001. The Clcr estimated by the correction method was very close to the theoretical Clcr. An overall mean error of -0.97% was observed. The difference observed was not statistically significant (p > 0.05).
Correlation of theoretical Clcr to Clcr estimated by Clcr (corr)
The R2 value using the correction method was 0.9981, n= 199, p < 0.005. There was an almost perfect correlation observed between Clcr estimated by correction method and theoretical Clcr.
Verification of correction method in a larger sample of simulated data with improving kidney functions ≥ 35 ml/min.
The validity and consistency of the correction method was tested on 200 simulated data (with C0 err and C24 err). The correction method revealed has less error and more consistent to the theoretical Clcr, R2 = 0.994. A 3.73% mean error was observed in Clcr estimated by correction method with reference to theoretical Clcr, p= 0.065.
Discussion
The 24-hours Clcr is an accepted method to assess kidney function. One of the limitations of the measured 24-hours of urinary creatinine clearance was calculated by using the C1, C2 (2 points) average method. Most clinical laboratories use a 24 hours urinary creatinine clearance and a serum concentration obtained at the beginning (C1) or end (C2) of a urinary creatinine collection period [12]. However, the 2 points average method is only valid in patients with stable kidney functions [6]. In patients with unstable kidney functions specifically with rapidly improving renal functions, the 2-points average method is proven to produce highly variable and inaccurate results. The degree of deviation from the real Clcr using the 2-points average method was significant when the Clcr is greater than 40 ml/min (in patients with improving kidney function). The mean errors increase when the Clcr rapidly increases. This observation was secondary to the non-linear changes in serum creatinine during improving kidney function. A similar trend was observed in patients with deteriorating kidney function, however, the difference observed was not statistically and clinically significant [6].
In order to overcome the potential error of calculated 24 hours urinary creatinine clearance in patients with improving kidney function, we constructed a theoretical group of patients and simulated their serum creatinine concentration at C0, C12and C24. AUC was calculated using a 2-points average approach and integration approach. The actual urinary creatinine clearance, Ae was calculated by using AUC0-24. The patients’ serum creatinine concentrations were simulated by using a one-compartmental pharmacokinetics model. Previous studies showed that one compartmental model is sufficient to describe the creatinine kinetics in patients who are renally impaired or with unstable kidney functions [6][10].
The equations for correction were derived from figure 2. The derived equation was then tested on simulated data using C0 (err) and C24 (err). An 15% error were intentionally introduced randomly to simulated patients to resemble the real world’s data by which there is a reported laboratory essay error within ±15% [9][13]. The derived correction methods were further validated in a larger sample (200 data) of simulated data with various degree of improving kidney functions and various ages, body weights and gender. This step was performed to check for the reliability, validity and reproducibility of the correction method [14].
This study was performed using a one-compartmental pharmacokinetic model to describe the endogenous creatinine. Even though it is claimed that a two-compartmental model shall be more accurate in describing creatinine’s kinetics [15][16], the available pharmacokinetic data proves that a one-compartmental model is generally sufficient to describe the creatinine kinetics in kidney-impaired (but relatively stable) patients [17] or in patients with unstable kidney function. Hence, the results of this study based on such a model should be reasonably valid for clinical purposes. The correction factor yielded in this study shall be able to address the pitfall of underestimating one’s kidney function up to 38%. The normal acceptable range of variation between the two methods shall be placed at the cut-off point of 30% [18] An underestimation of one’s kidney function may lead to the potentially underdose of medication leading to treatment failure.
Conclusion
During improving kidney function, measuring urinary creatinine clearance using a 2-points average method can produce highly inaccurate creatinine clearance measurement, particularly at creatinine clearance greater than 35 ml/min. An approximate 20% of mean error difference was observed between Clcr (corr) and Clcr using the 2-points average method during improving kidney functions. The 2-points average method is the method used to calculate the 24-hours creatinine clearance using serum creatinine concentrations at the beginning and at the end of the urine collection process. As such, in order to obtain Clcr for patients with improving renal functions without significant error to the actual Clcr, the reported measured Clcr can be corrected using the derived correction factor, which is 65 • [(Clcr(ne))/33].
Limitation
The model used in the data simulation assumed the muscle mass and creatinine volume of distribution as constant. This may not observe in real patients due to nutritional status and aggressive hydration received at intensive care unit setting.
Conflict of Interest
The authors declare no conflict of interest.
References
- Ralib AM, Nanyan S, Ramly NF, Har LC, Cheng TC, Mat Nor MB. Aucte kidney injury in Malaysian intensive care setting: Incidences, risk factors, and outcomes. Indian J Crit Care Med. 2018; 22: 831-835 https://doi.org/10.4103%2Fijccm.IJCCM_193_18
- KDIGO Clinical Practice Guideline for Acute Kidney Injury. Kidney Int Suppl 2012; 2:8. https://kdigo.org/wp-content/uploads/2016/10/KDIGO-2012-AKI-Guideline-English.pdf
- Duarte CG, Preuss HG. Assessment of renal function – glomerular and tubular. Clin Lab Med. 1993; 13(1): 33-52. https://pubmed.ncbi.nlm.nih.gov/8462268/
- Schwartz GJ, Haycock GB, Edelmann CM, Spitzer A. A simple estimate of glomerular filtration rate in children derived from body length and plasma creatinine. Pediatrics. 1976 Aug;58(2):259-63. https://pubmed.ncbi.nlm.nih.gov/951142/
- Gowda S, Desai PB, Kulkarni SS, Hull VV, Math AA, Vernekar SN. Markers of renal function tests. N Am J Med Sci. 2010 Apr; 2(4):170-3. https://pubmed.ncbi.nlm.nih.gov/22624135
- Chow and Schweizer. Estimation of renal creatinine clearance in patients with unstable serum creatinine concentrations: Comparison of multiple methods. Drug Intelligence and Clinical Pharmacy. 1985; 19: 385-390. https://doi.org/10.1177/106002808501900513
- Chiou WL, Hsu FH. A new simple and rapid method to monitor the renal function based on pharmacokinetic consideration of endogeneous creatinine. Res Commun Chem Pathol Pharmacol. 1975; 10: 315-30. https://pubmed.ncbi.nlm.nih.gov/1153839/
- Winter MA, Guhr KN, Berg GM. Impact of various body weight and serum creatinine concentrations on the bias and accuracy of the Cockcroft-Gault equation. Pharmacotherapy 2012; 32(7): 604-612. https://doi.org/10.1002/j.1875-9114.2012.01098.x
- US Food and Drug Administration. Guidance for industry: pharmacokinetics in patients with impaired renal function – study design, data analysis and impact on dosing. Beltsville, MD: Center for Drug Evaluation and Research. 2020. https://www.regulations.gov/docket/FDA-2010-D-0133
- Hankins DA, Babb AL, Uveli DA, Scribner BH. Creatinine degradation. II: Mathematical model including the effect of extra-renal removal rates. Int J Artif Organs. 1981; 4: 68-71. https://pubmed.ncbi.nlm.nih.gov/7275337/
- Field A Discovering statistics using SPSS 2nd edition. London: Sage publications ltd. 2005. http://dx.doi.org/10.1348/000709906X100611
- Stevens LA, Coresh J, Greene T, Levey AS. Assessing kidney function–measured and estimated glomerular filtration rate. N Engl J Med. 2006 Jun 08;354(23):2473-83. https://doi.org/10.1056/nejmra054415
- Robert LS, Joely AS, Kalani LR. A risk assessment of the Jaffe vs Enzymatic method for creatinine measurement in an outpatient population. PLOS One. 2015; 10(11): e0143205. https://doi.org/10.1371/journal.pone.0143205
- Emmanuelle A, Lela M, Antoine R, Vronique S and Jean-Benoit H. Sample size used to validate a scale: a review of publications on newly-developed patient reported outcomes measures. Health and Quality of Life Outcomes. 2014; 12: 176. https://doi.org/10.1186/s12955-014-0176-2
- Hankins DA, Babb AL, Uvelli DA, Scribner BH. Creatinine degradation. I: the kinetics of creatinine removal in patients with chronic kidney disease. Int. J Artif Organs. 1981; 4: 35-9. https://pubmed.ncbi.nlm.nih.gov/7216531/
- Boroujerdi M. The comparability of pharmacokinetics of creatinine in rabbit and man: a mathematical approach. J Theor Biol. 1982; 95: 369-80. https://doi.org/10.1016/0022-5193(82)90251-X
https://ui.adsabs.harvard.edu/link_gateway/1982JThBi..95..369B/doi:10.1016/0022-5193(82)90251-X - Hankins DA, Babb AL, Uvelli DA, Scribner BH. Creatinine degradation. II: Mathenatical model including the effect of extra-renal removal rates. Int J Artif Organs. 1981; 4: 68-71. https://pubmed.ncbi.nlm.nih.gov/7275337/
- Critchley LA, Critchley JA. A meta-analysis of studies using bias and precision statistics to compare cardiac output measurement techniques. J Clin Monit Comput. 1999; 15: 85-91. https://doi.org/10.1023/a:1009982611386
Appendix
Please cite this article as:
Yen Ping Ng, Jin Yi Choo, Cheng Hoon Yap, Boon Seng Tan, Yee Mei Ng and Jing Ng, Deriving a more Accurate Method to Calculate Creatinine Clearance when using Two Levels of Serum Creatinine (C0 and C24) in Patients with Rapidly Improving Kidney Function: A Simulation Approach. Malaysian Journal of Pharmacy (MJP). 2023;1(9):22-28. https://mjpharm.org/deriving-a-more-accurate-method-to-calculate-creatinine-clearance-when-using-two-levels-of-serum-creatinine-c0-and-c24-in-patients-with-rapidly-improving-kidney-function-a-simulation-approach/